

La Union’s fisheries production rises in 4th quarter 2023
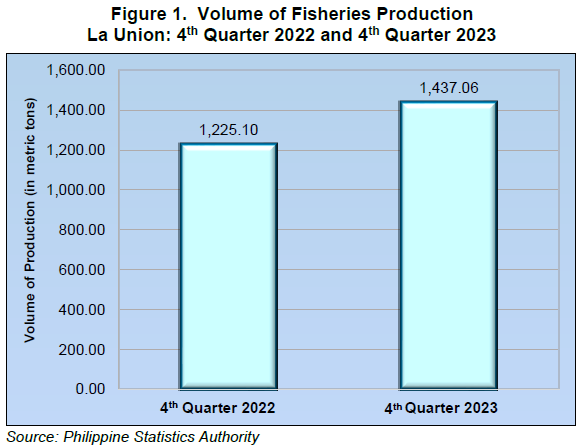
La Union’s total volume of fisheries production in 4th quarter 2023 was recorded at 1,437.06 metric tons, an increase of 17.30 percent from the 1,225.10 metric tons production in 4th quarter 2022. (Figure 1)
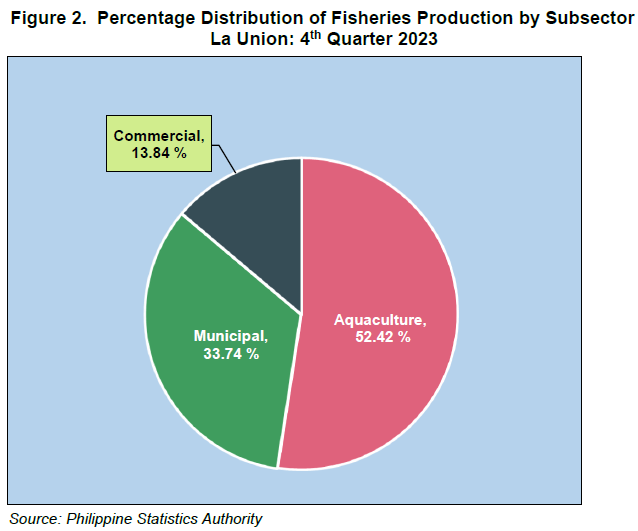
Among the fisheries subsectors, aquaculture posted the largest contribution to the fisheries output in the province in 4th quarter 2023 with a share of 753.32 metric tons or 52.42 percent of the total fisheries production of the province. Municipal fisheries ranked second with 484.84 metric tons contributing 33.74 percent to the total fisheries production of the province. Commercial fisheries had the smallest contribution to the total volume of production in the province with 198.90 metric tons or 13.84 percent share. (Figure 2)
In 4th quarter 2023, the top five species in terms of volume of production were: Milkfish (Bangus) with 677.65 metric tons (47.16 percent share) distantly followed by Blue Crab (Alimasag) with 71.65 metric tons (4.99 percent share); Tilapia with 52.14 metric tons (3.63 percent share); Slipmouth (Sapsap) with 49.22 metric tons (3.43 percent share); and Goatfish (Saramulyete) with 48.54 metric tons (3.38 percent share).
Municipal Fisheries
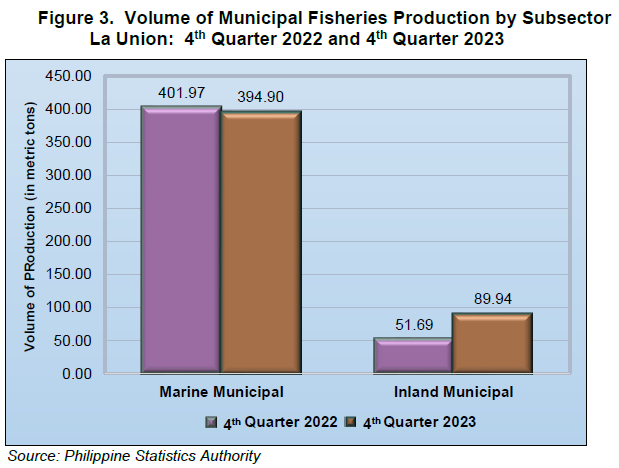
The total municipal fisheries production in La Union increased by 6.87 percent from the estimated production of 453.66 metric tons in 4th quarter 2022 to 484.84 metric tons in 4th quarter 2023.This subsector was comprised of 81.45 percent production from marine municipal fisheries and 18.55 percent production from inland municipal fisheries.
On the contrary, the volume of production from marine municipal fisheries dropped by 1.76 percent from 401.97 metric tons in 4th quarter 2022 to 394.90 metric tons in 4th quarter 2023. Meanwhile, the volume of production from inland municipal fisheries went up by 74.00 percent from 51.69 metric tons in 4th quarter 2022 to 89.94 metric tons in 4th quarter 2023.
Municipal fisheries data were gathered from administrative records of the Philippine Fisheries Development Authority (PFDA), Local Government Unit (LGU) - managed landing centers and traditional landing centers.
Aquaculture
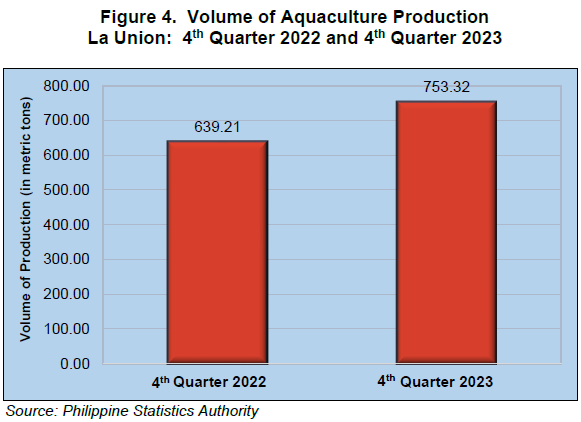
The aquaculture production in La Union was posted at 753.32 metric tons in 4th quarter 2023. This translates to an increase of 17.85 percent from the 639.21 metric tons production in 4th quarter 2022. (Figure 4)
Milkfish dominated the aquaculture production of the province in 4th quarter 2023 with 677.65 metric tons. It was distantly followed by Tilapia and Oyster production with 45.25 metric tons and 14.06 metric tons, respectively. Milkfish production increased by 27.08 percent from its production in the same period a year ago of 533.24 metric tons. Likewise, Tilapia production increased by 26.64 percent from 35.73 metric tons in 4th quarter 2022 to 45.25 metric tons in 4th quarter 2023.
On the other hand, Oyster production decreased by 49.32 percent from 27.74 metric tons in 4th quarter 2022 to 14.06 metric tons in 4th quarter 2023.
Commercial Fisheries
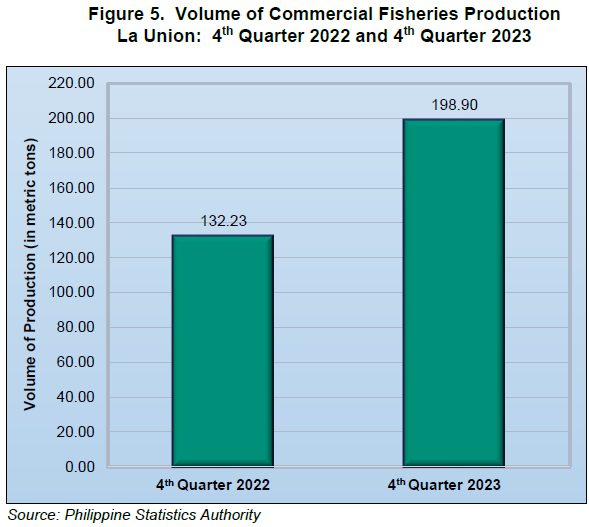
The volume of production from commercial fisheries was posted at 198.90 metric tons in 4th quarter 2023. It went up by 50.42 percent from 132.23 metric tons in the same period a year ago. (Figure 5)
Data for commercial fisheries were obtained from LGU-managed fish landing centers, privately-managed fish landing centers, and traditional fish landing centers.
Value of fisheries production in La Union decreases in 4th quarter 2023
The total value of all fisheries production in La Union in 4th quarter 2023 was PhP229,110.68. This is 13.42 percent higher than its value in the same quarter a year ago of PhP202,001.48.
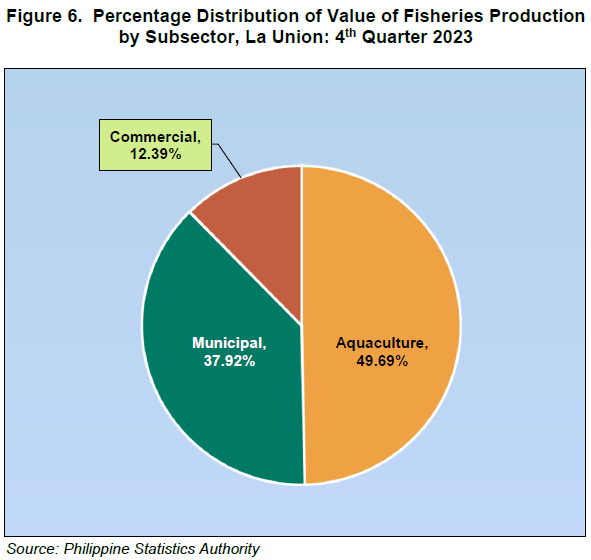
In terms of value of production, aquaculture topped the three subsectors in 4th quarter 2023 with a share of 49.69 percent to the total value of fisheries production in the province. The remaining 50.31 percent of the provincial total value of production was contributed by municipal fisheries with 37.92 percent share and commercial fisheries with 12.39 percent share. (Figure 6)
All subsectors exhibited an increase in their respective value of fisheries production compared with their value of fisheries production in 4th quarter 2022. Aquaculture recorded an increase of 10.58 percent from PhP102,949.81 in 4th quarter 2022 to PhP113,842.14 in 4th quarter 2023. Municipal fisheries increased by 10.07 percent from PhP78,927.45 in 4th quarter 2022 to PhP86,872.83 in 4th quarter 2023 while commercial fisheries increased by 41.10 percent from PhP20,124.22 in 4th quarter 2022 to PhP28,395.71 in 4th quarter 2023.
TECHNICAL NOTES
Aquaculture is a fishery operation involving all forms of raising and culturing of fish and other fishery species in fresh, brackish and marine water areas. The operation is comprised of activities from stocking to harvesting of species under controlled conditions in farming facility called aquafarm.
Aquaculture Production refers to the volume harvested from the aquafarm. It includes those species harvested in marketable/matured size and in fresh form.
Inland Municipal Fishing – the catching of fish, crustaceans, mollusks and other aquatic animals and plants in inland waters like lakes, rivers, dams, marshes, etc. using simple gears and fishing boats some of which are non-motorized with a capacity of less than three gross tons, or fishing not requiring the use of fishing boats.
Landing Center is a place where the fish catch and other aquatic products are unloaded and traded. Traditional landing center is a type of landing center where fishermen could unload their catch and/or dock their fishing boats without any obligation or payment for the use of the place.
Quarterly Aquaculture Survey is a quarterly survey that generates estimates of volume and value of production per aquafarm type and species for the subsector.
Quarterly Inland Fisheries Survey is a survey on volume and price of fish by species, caught by households engaged in inland fishing. It gathers quarterly data with monthly catch from sample fishing households. Respondents are fishermen or any knowledgeable member of the sample household.
Quarterly Commercial Fisheries Survey (Traditional Landing Center) is a quarterly survey on the volume of fish unloading in traditional landing centers and the price of fish by species. It gathers data on a quarterly basis but the information that is collected is about monthly fish unloading.
Quarterly Commercial Fisheries Survey (Philippine Fisheries Development Authority (PFDA), Local Government Units (LGUs), Privately-Managed Landing Centers) is the gathering of data from the records of the PFDA, LGU and privately-managed landing centers. It is done on a quarterly basis but the information being collected is on each of the three months included in the reference quarter.
Quarterly Municipal Fisheries Survey (Traditional Landing Center) – is a survey on volume and price of fish, by species, unloaded by fishing boats three gross tons or less. It gathers quarterly data for the entire sample landing center with information on monthly fish unloading.
Quarterly Municipal Fisheries Survey PFDA, LGUs, Privately-Managed Landing Centers is gathering of data on volume and price of fish from administrative records of PFDA and LGU-managed landing centers. It is done on a quarterly basis with information from three-month period.
SGD. DANITES E. TEÑIDO, PhD
Chief Statistical Specialist
/MAQ/MFC


