The headline inflation rate in Ilocos Sur declined to 4.2 percent in February 2025, a decrease of 1.1 percentage points from the 5.3 percent recorded in January 2025. Furthermore, this month’s inflation rate marks an increase of 5.3 percentage points compared to the same month in the previous year, which had an inflation rate of -1.1 percent.
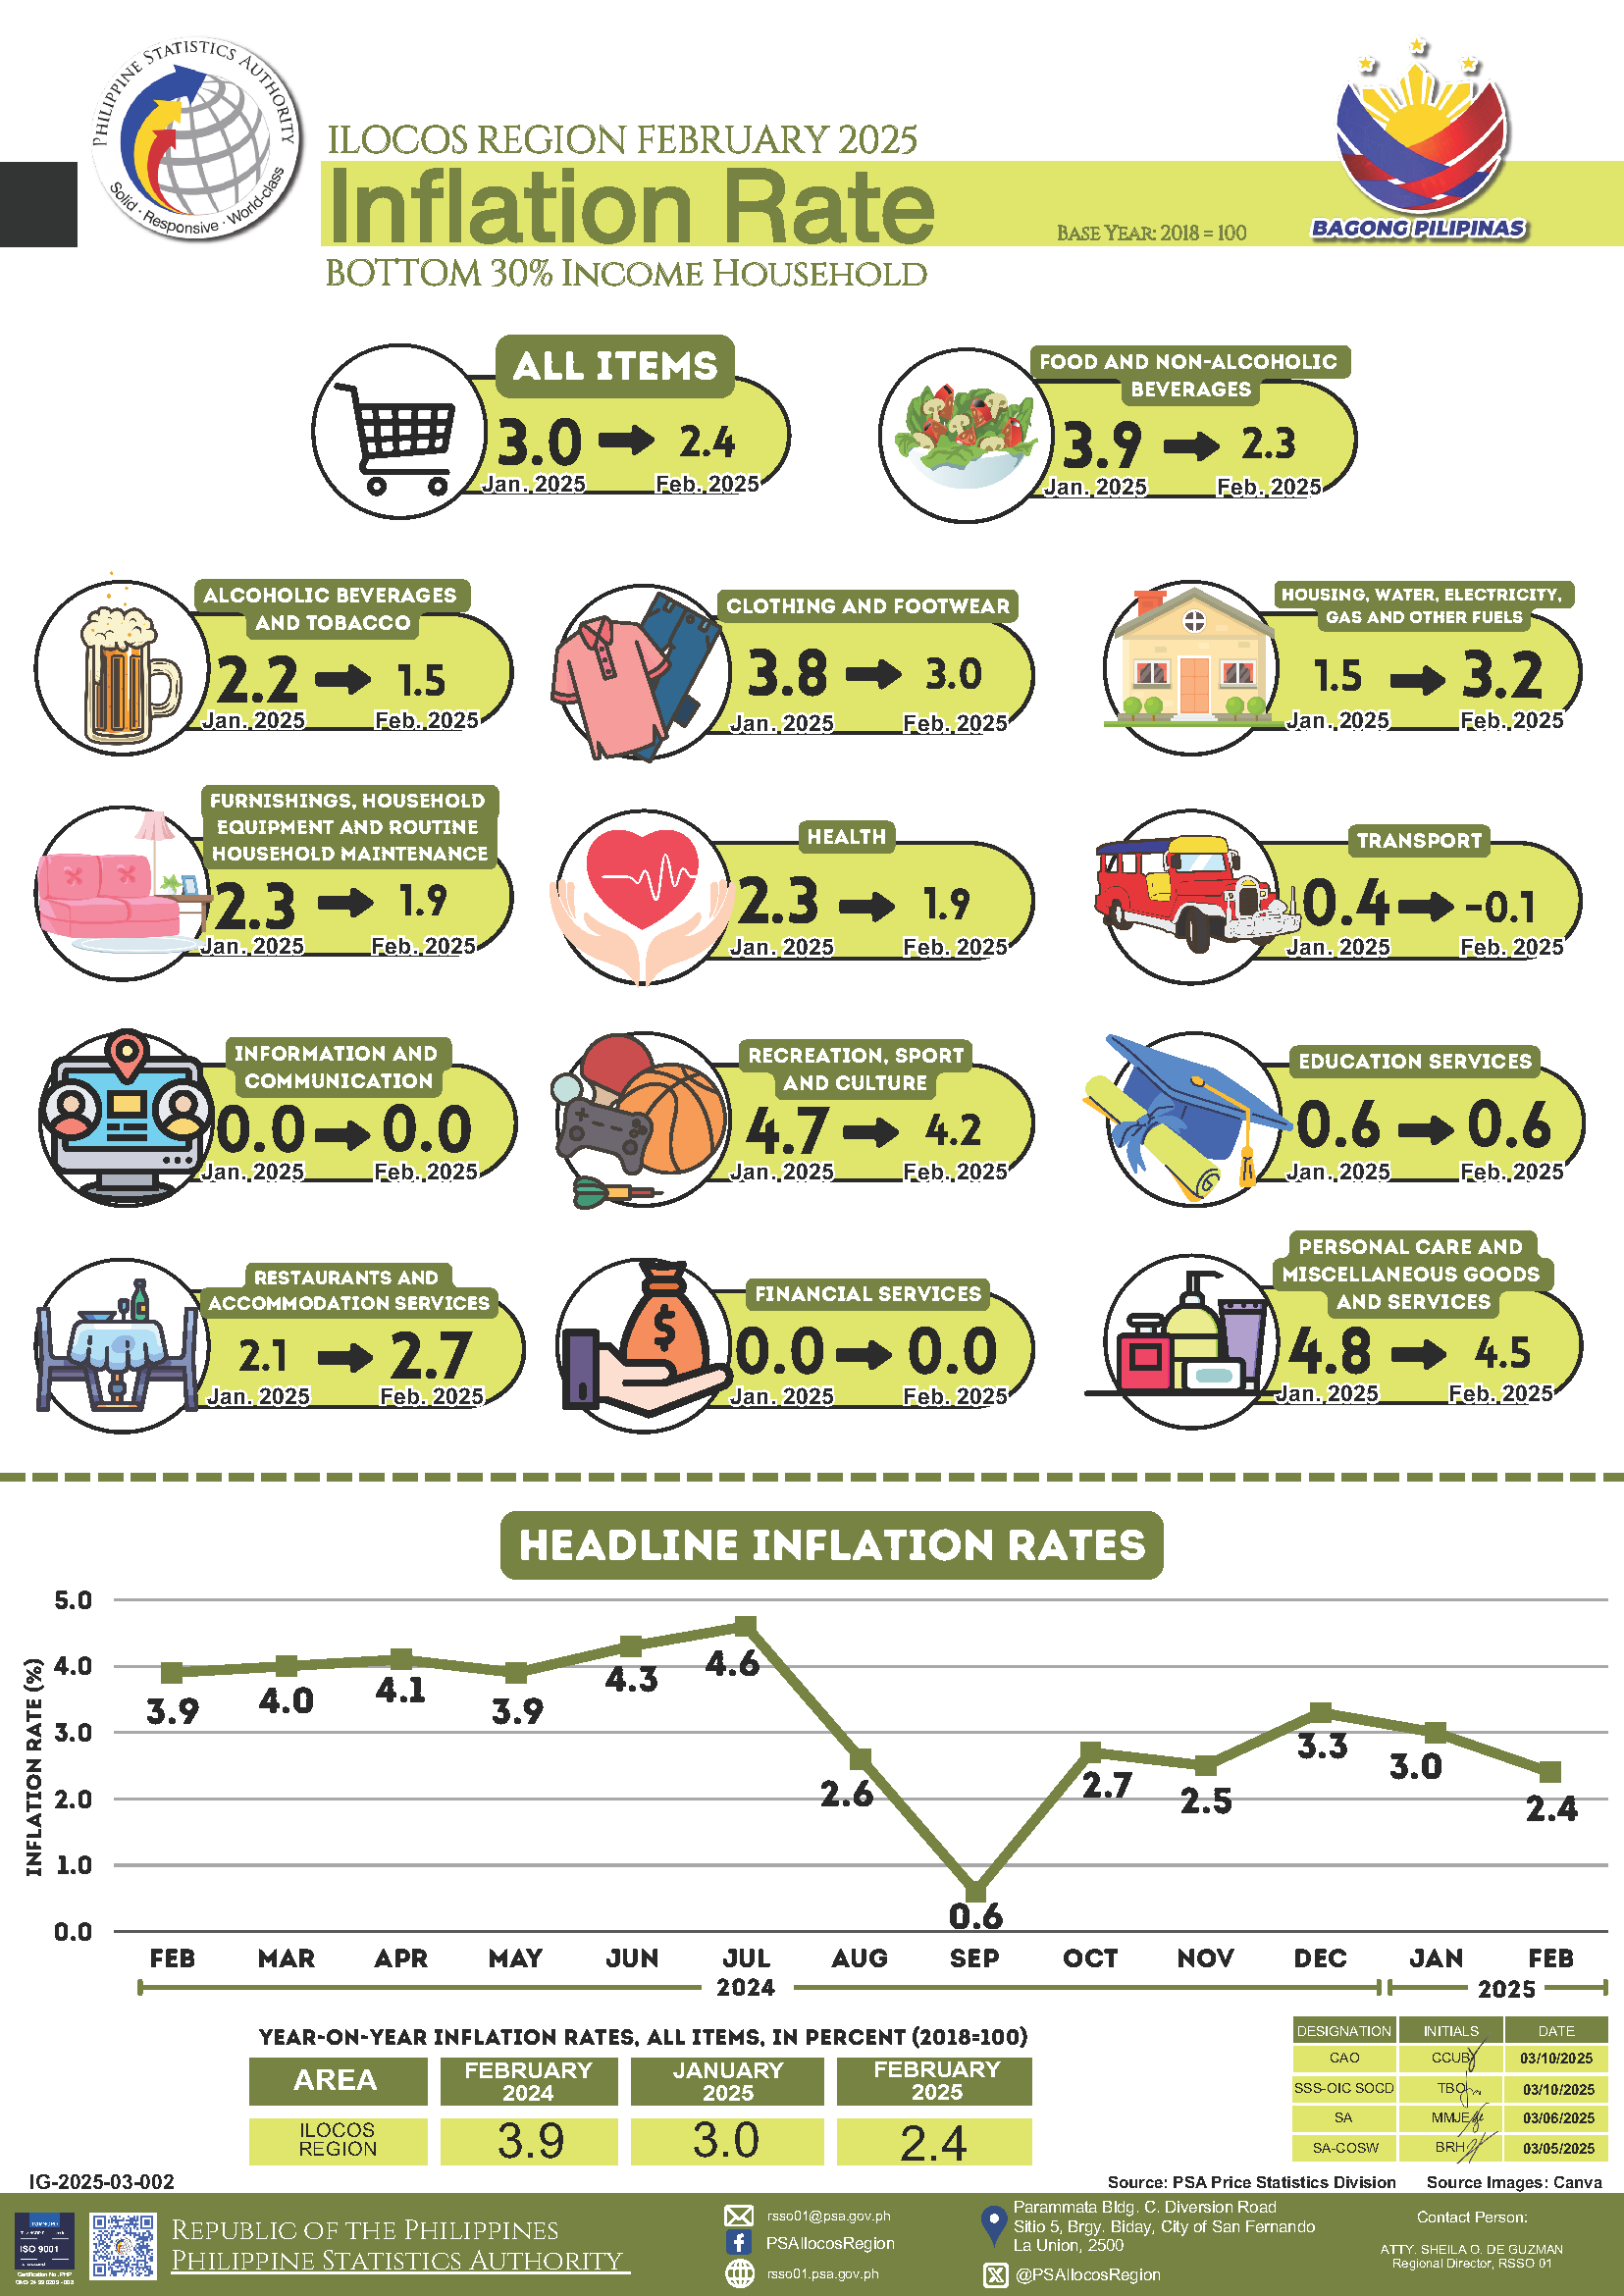
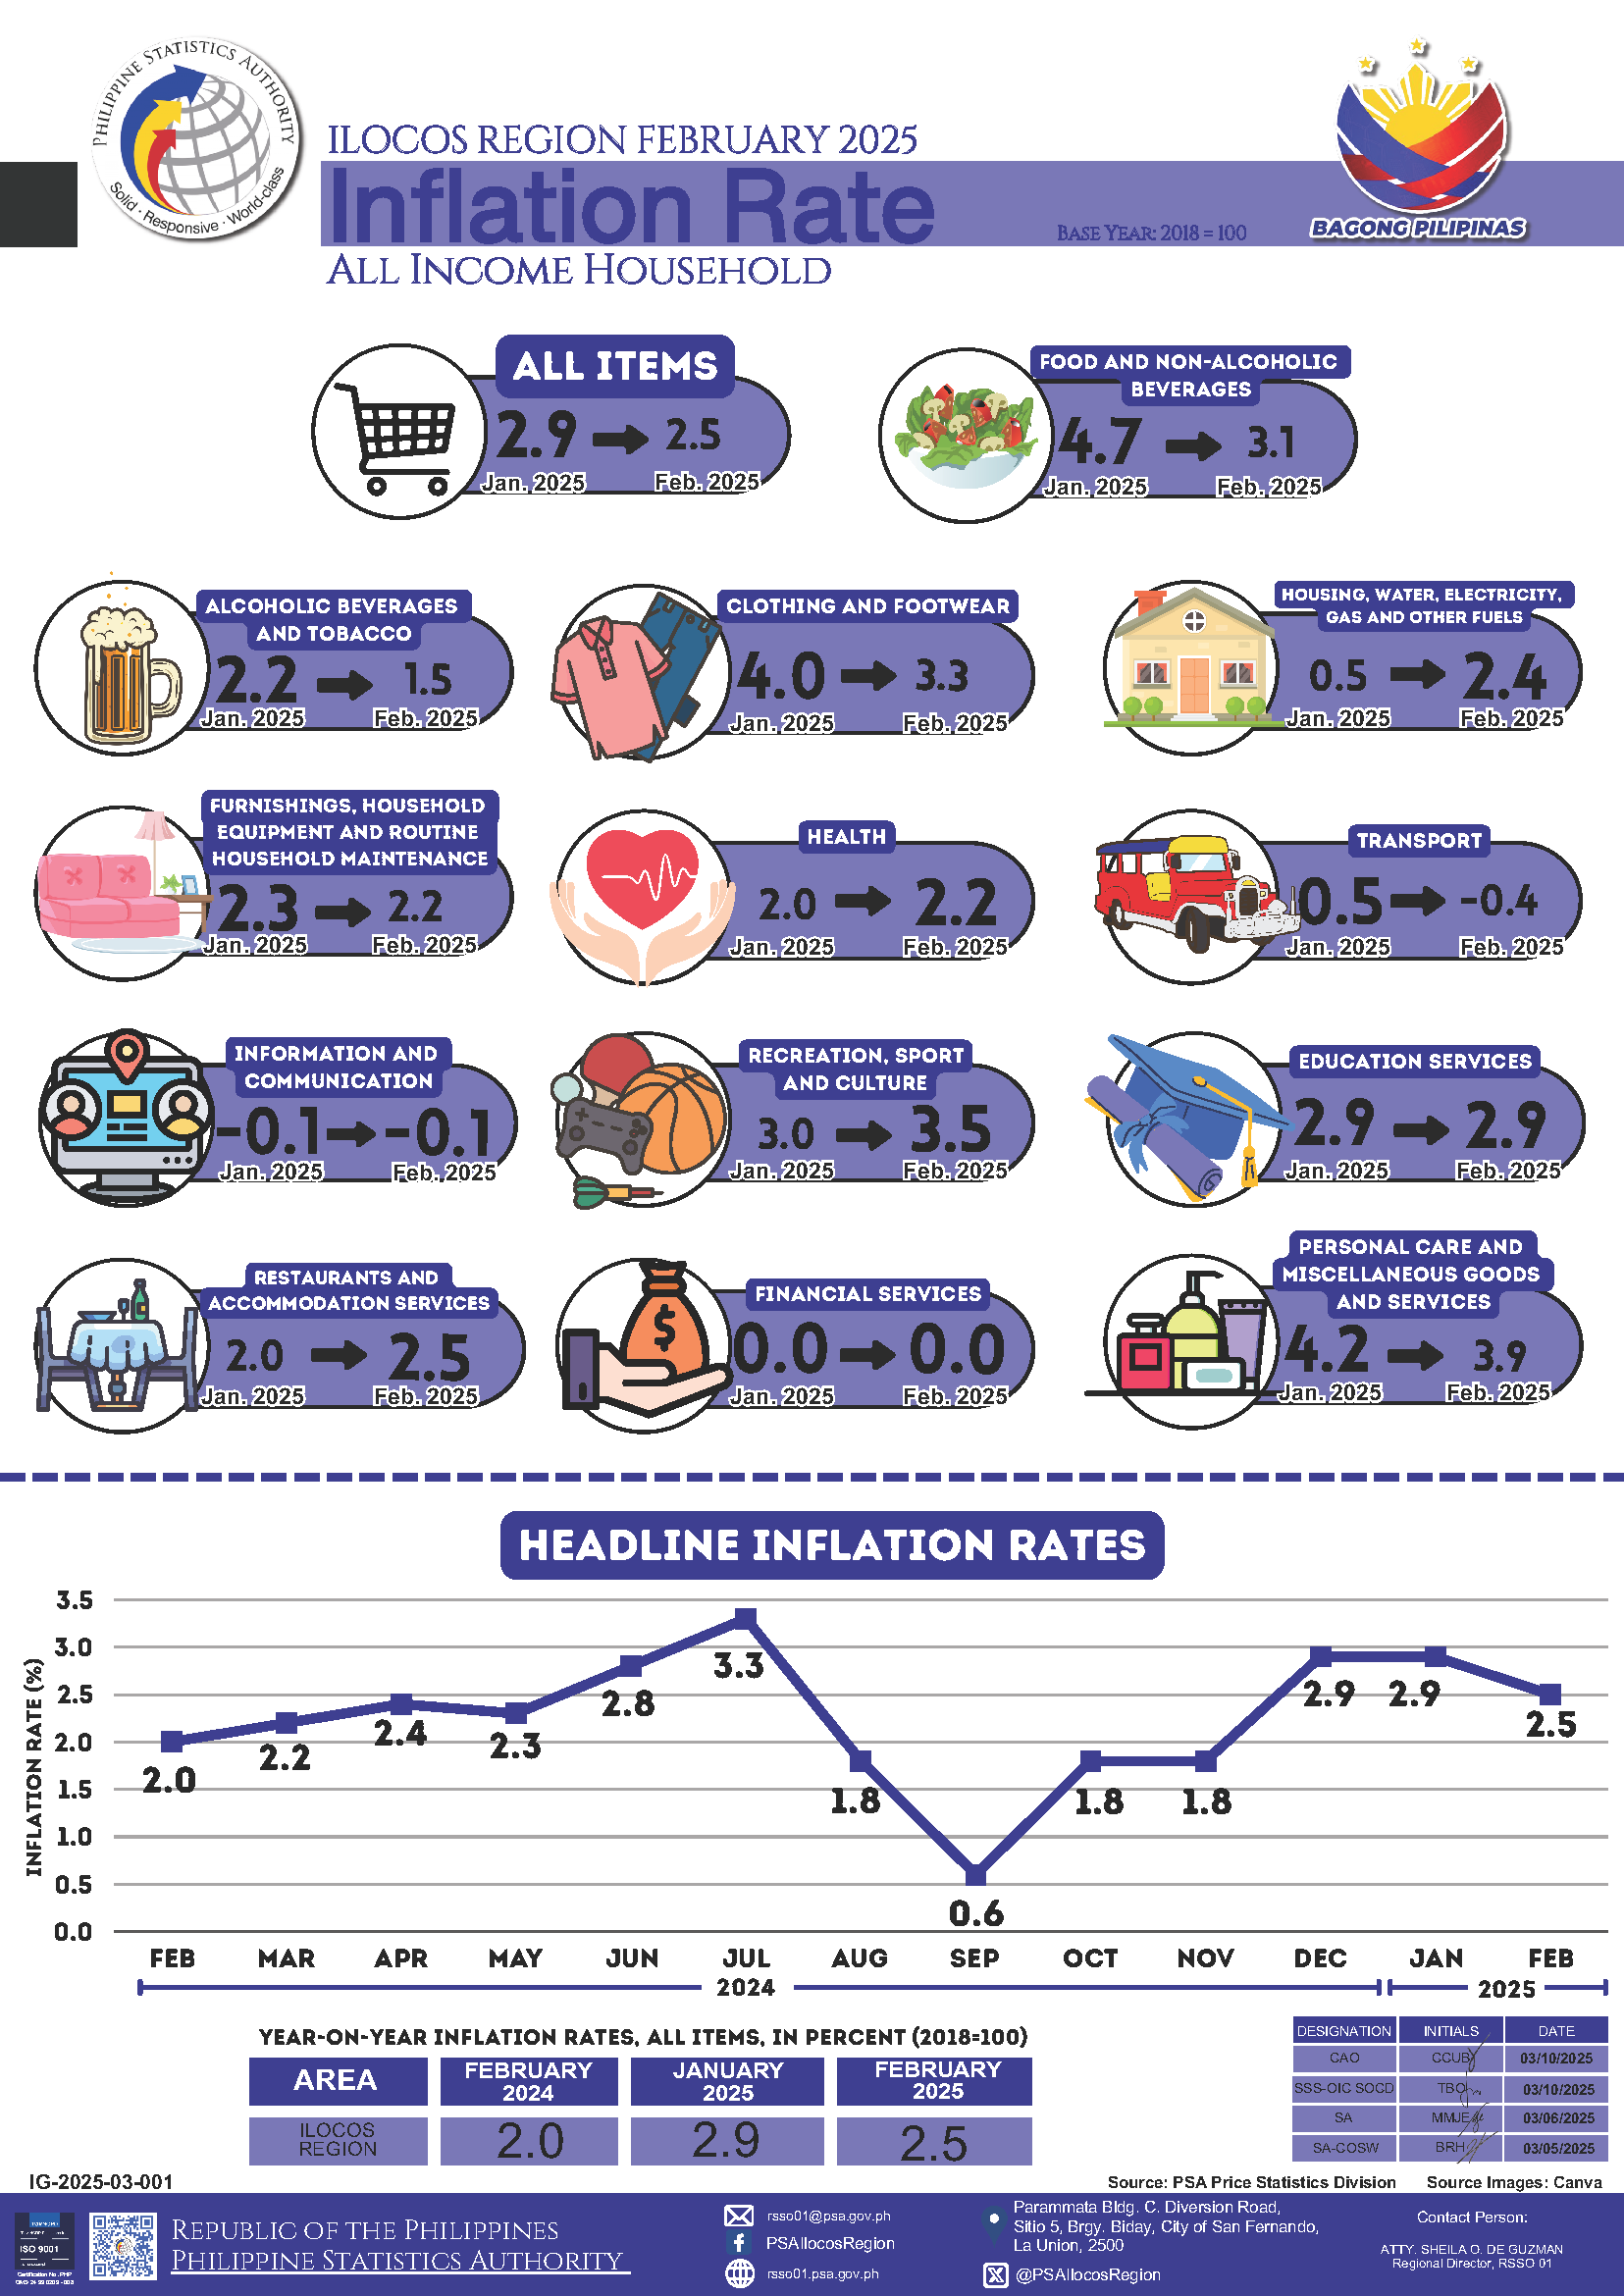
Meanwhile, the headline inflation rate for the Ilocos Region in February 2025 was reported at 2.5 percent. This rate is 1.7 percentage points lower than that of the province and 0.4 percentage point higher than the national inflation rate, which stood at 2.1 percent. The national inflation rate decreased by 0.8 percentage point in February 2025 compared to the previous month, when it was recorded at 2.9 percent.
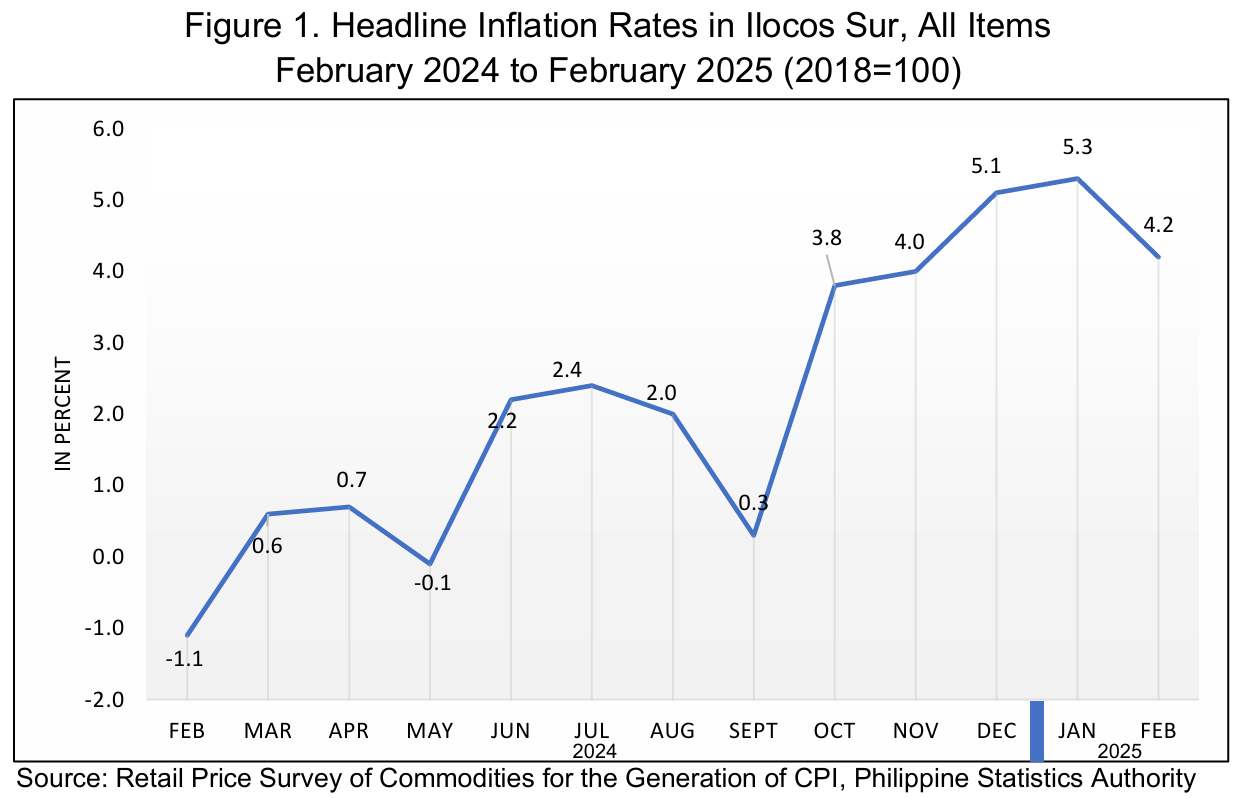
Figure 1 illustrates the headline inflation rates in Ilocos Sur from February 2024 to February 2025. Deflation was observed in February 2024 and May 2024, at -1.1 percent and -0.1 percent, respectively. In January 2025, inflation was recorded at 5.3 percent, which then decreased to 4.2 percent in February 2025.
The downward trend in the overall inflation rate has been attributed to the following commodity groups: Food and Non-Alcoholic Beverages, at 6.4 percent from 8.4 percent with 71.9 percent share to downtrend; Transport, at -0.6 percent from 2.1 percent; Alcoholic Beverages and Tobacco, at 3.3 percent from 4.5 percent; Personal Care, and Miscellaneous Goods and Services, at 5.4 percent from 5.9 percent; Furnishings, Household Equipment and Routine Household Maintenance, at 3.1 percent from 3.3 percent; and Clothing and Footwear, at 3.3 percent from 3.4 percent.
Conversely, the following commodity groups experienced increase in inflation rate compared to the previous month: Housing, Water, Electricity, Gas and Other Fuel, at 3.1 percent from 2.5 percent; and Health, at 2.4 percent from 2.3 percent.
The remaining major commodity groups showed no change in their inflation rates for February 2025 compared to the previous month.
Food inflation in the province decelerated to 6.6 percent in February 2025 from 8.7 percent in January 2025. The following food groups exhibited decreases in inflation rates during the month:
a. Rice, at -1.6 percent from 3.0 percent;
b. Fish and other seafood, at 8.4 percent from 10.1 percent; and
c. Vegetables, tubers, plantains, cooking bananas, and pulses, at 11.9 percent from 43.3 percent.
On the other hand, the following food groups posted increases in inflation rates:
a. Meat and other parts of slaughtered land animals, at 11.1 percent from 4.8 percent;
b. Milk, other dairy products, and eggs, at 1.3 percent from -0.4 percent;
c. Fruits and nuts, 26.5 at percent from 23.3 percent;
d. Sugar, confectionery, and desserts, at 1.3 percent from 1.1 percent; and
e. Ready-made food and other food products, at 9.6 percent from 9.4 percent.
Meanwhile, the inflation rates of the following food groups remained unchanged in February 2025 compared to the previous month:
a. Corn at 27.3 percent;
b. Flour, bread and other bakery products, pasta products, and other cereals at 4.2 percent; and
c. Oils and fats at 1.2 percent.
For the Chief Statistical Specialist:
SGD. JOHN MICHAEL S. SARABIA
Supervising Statistical Specialist
(Officer-in-Charge)
Per SO No. RSSO I-2503-0125
Dated 04 March 2025
Ilocos Sur Provincial Statistical Office