
 

Sustainable Development Goals

In September 2015, the United Nations Member States adopted a new global plan of action entitled, “Transforming Our World: The 2030 Agenda for Sustainable Development.”  The 2030 Agenda, its 17 Goals and 169 targets are a universal set of goals and targets that aim to stimulate people-centered and planet-sensitive change. 

The 193 member states of the United Nations (UN) gathered to affirm commitments towards ending all forms of poverty, fighting inequalities and increasing country’s productive capacity, increasing social inclusion and curbing climate change and protecting the environment while ensuring that no one is left behind over the next fifteen years. 

The Sustainable Development Goals (SDGs) and targets are integrated and indivisible, global in nature and universally applicable, and take into account different national realities, capacities and levels of development and respecting national policies and priorities.  Each government are expected to take ownership and establish national frameworks, set nationally-owned targets guided by the global level of ambition but taking into account country-level circumstances for the achievement of the 17 goals.  Countries will also decide how these aspirational and global targets should be incorporated in national planning processes, policies and strategies.  

In monitoring the SDGs and its corresponding targets, the UN Statistical Commission established an Inter-Agency and Expert Group on SDG Indicators (IAEG-SDG), which developed the SDG global indicator framework consisting of 232 unique indicators. 

In line with the Philippines' commitment in achieving the SDGs, the PSA Board issued PSA Resolution No. 04 Series of 2016, Enjoining Government Agencies to Provide Data Support to the Sustainable Development Goals (SDGs).  In this Resolution, all concerned government agencies are enjoined to provide the necessary data support to monitor the country's performance vis-à-vis the SDGs based on the indicator framework that shall be determined by NEDA, PSA and other government agencies.  Further, the Resolution designated the PSA as the official repository of SDG indicators in the Philippines.

Highlights of the Sustainable Development Goals (SDG) Pace of Progress in Ilocos Region based on the 2022 SDG Watch

Release Date:
Reference Number: 2023-009

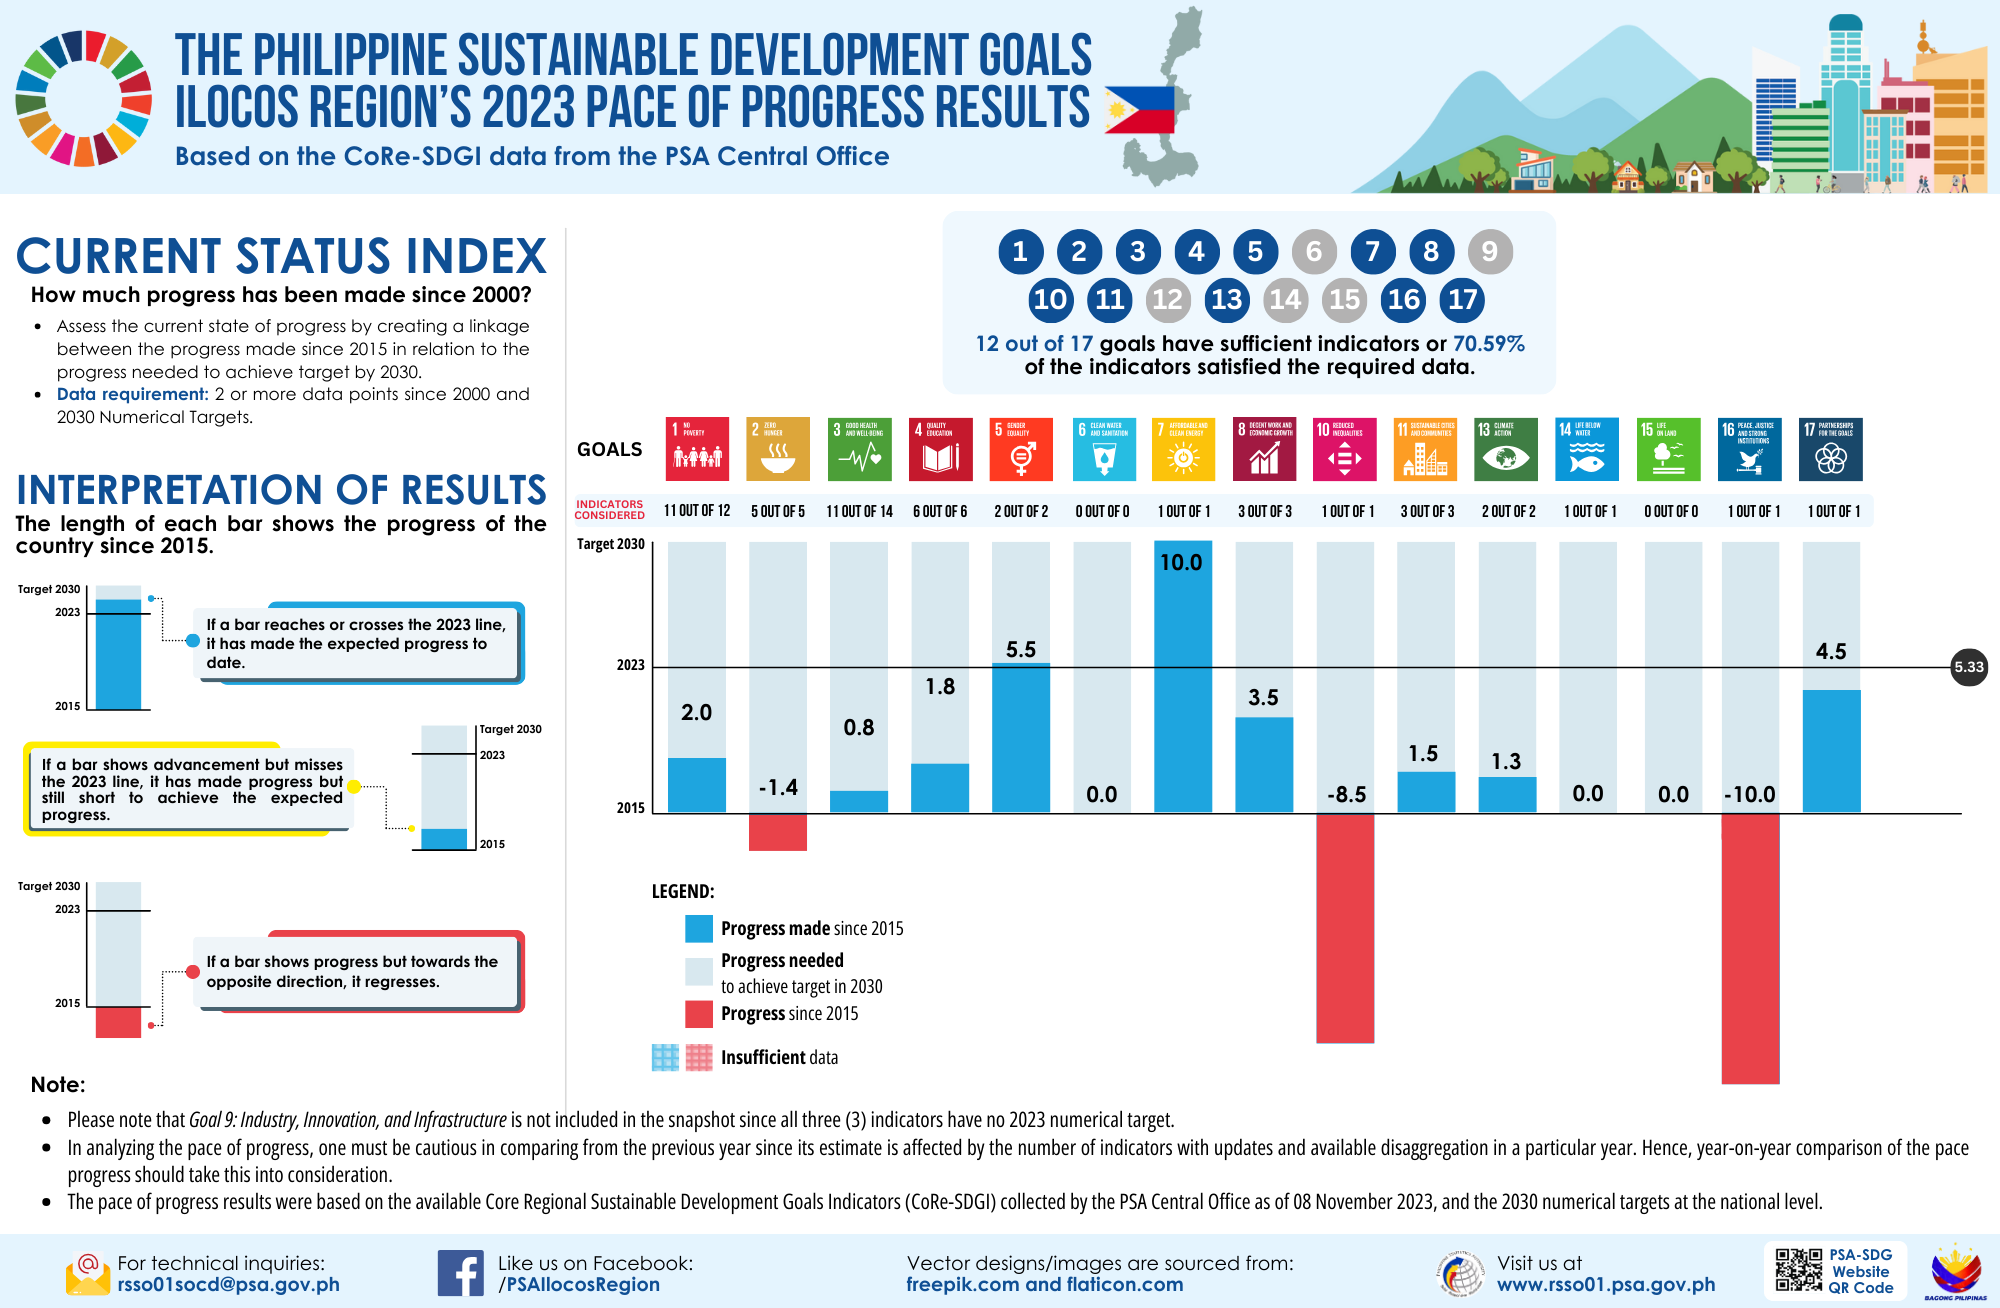
Current Status Index – How much progress has been made since 2015?

Fourteen out of the seventeen goals in the Ilocos Region have estimates for the Current Status Index (Figure 1). There were four goals (SDG 1, 7, 9, and 16) that reached or crossed the 2021 line, which means that the region has made the expected progress to date. Moreover, seven goals (SDG 3, 4, 5, 8, 11, 15, and 17) are behind but towards the 2021 line. Only SDG Goal 10: Reduced Inequalities needed progress to achieve that target in 2030. Furthermore, there were two goals (SDG 2 and 6) that regressed since 2015 to which a reverse trend is needed to achieve the 2030 target.


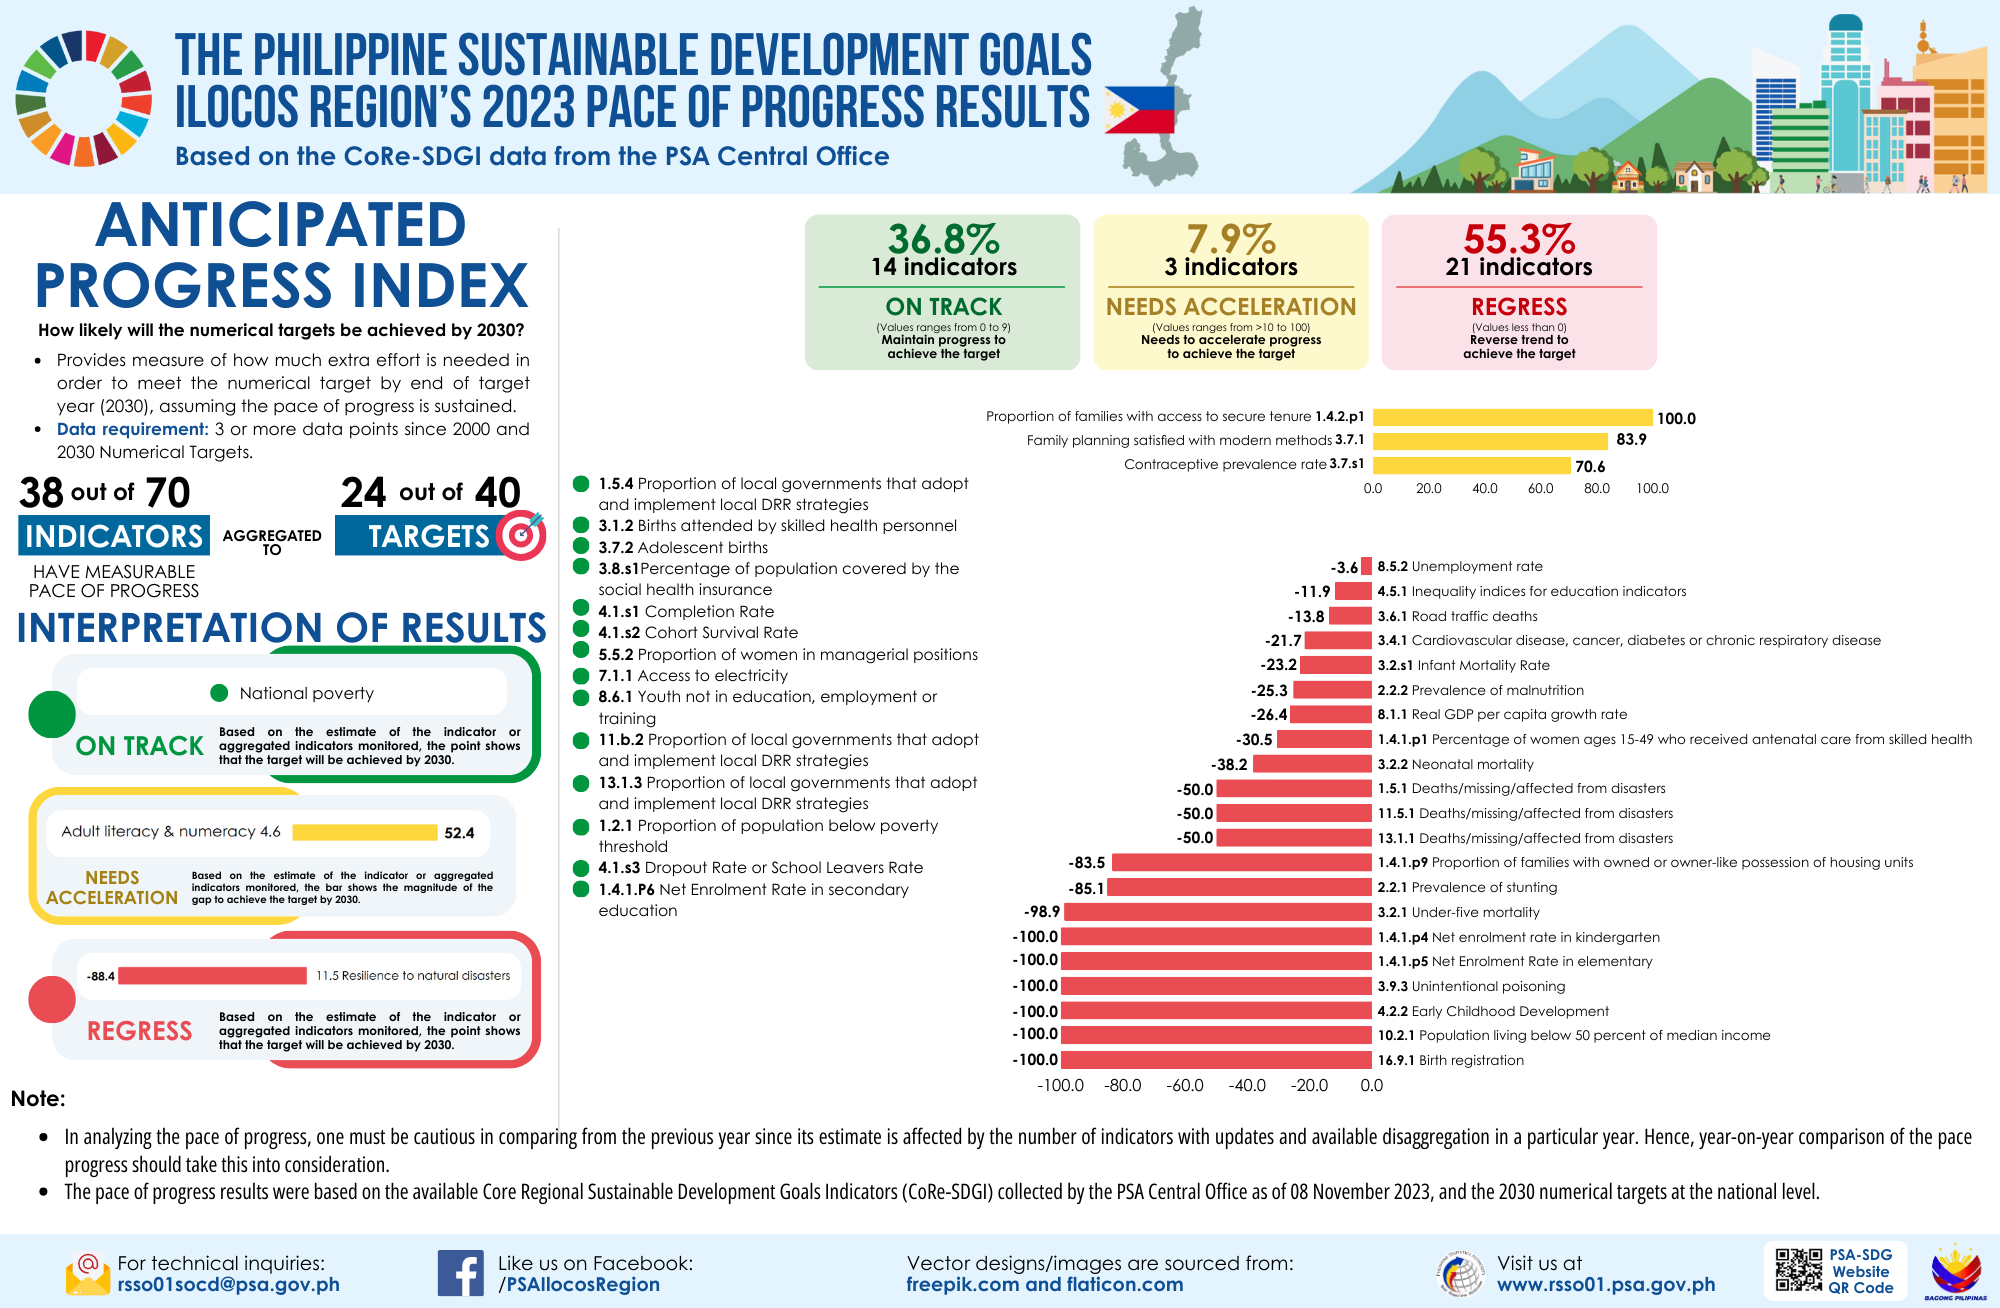
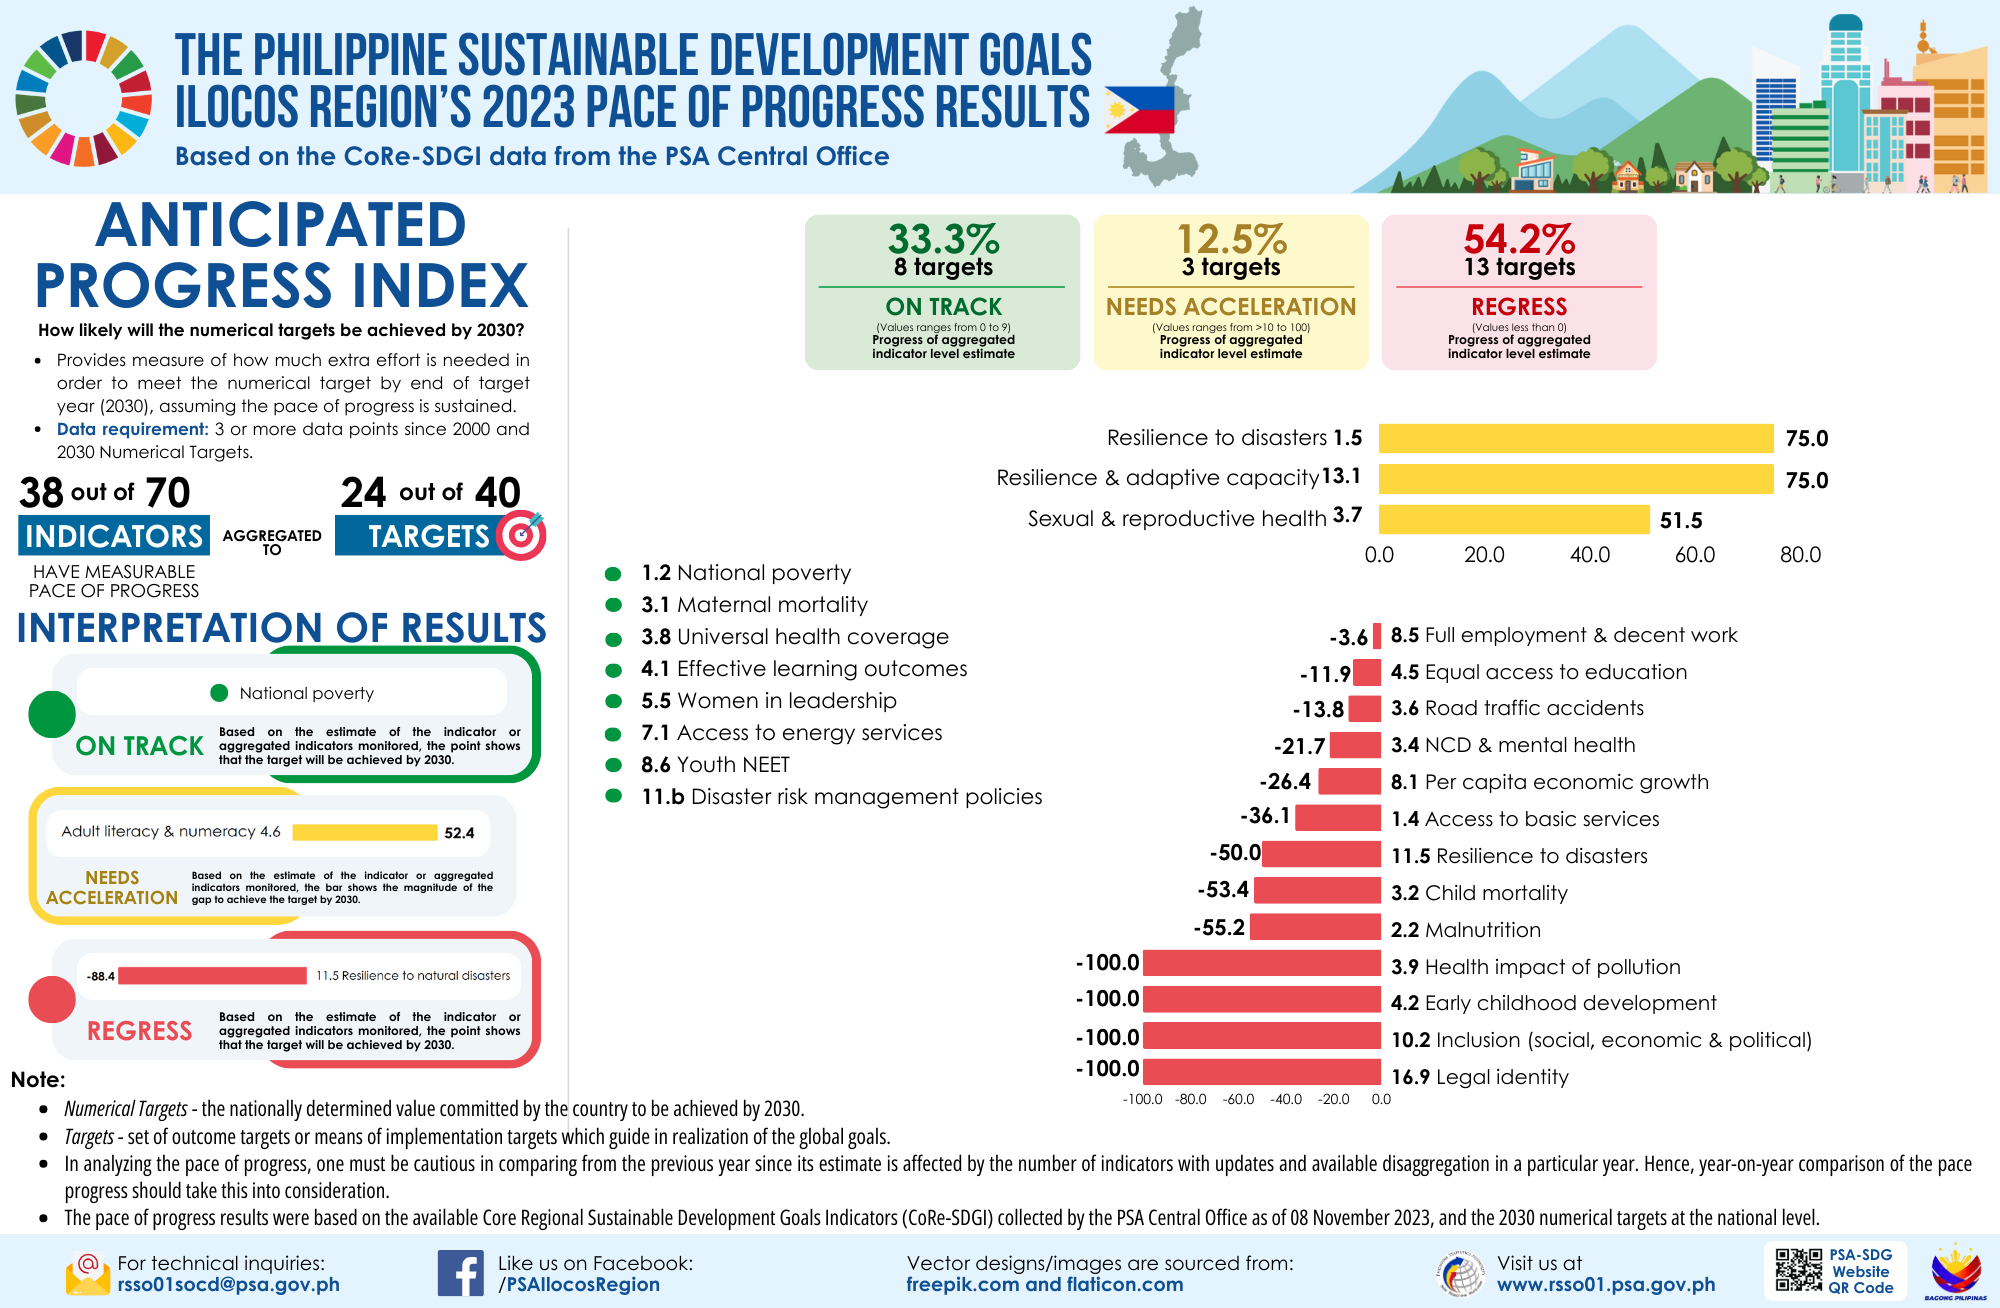
Anticipated Progress Index – How likely will the numerical target be achieved by 2030?

All 34 targets monitored in the Ilocos Region satisfied the data requirements, hence, have the pace of progress based on the Anticipated Progress Index (Table 1). As shown in Figure 2, among the 34 targets, eight targets are on track or need to maintain progress to achieve the target. However, 13 or 38.2 percent of the targets need acceleration while another 13 or 38.2 percent are regressing or need to reverse the trend to achieve the target.


At the indicator level, there are 82 out of 87 indicators in Ilocos Region that have pace of progress (Table 2). Among the 82 indicators, 30 indicators are on track (Figure 3), 19 indicators (23.2 percent) need acceleration (Figure 4), and 33 indicators (40.2 percent) are regressing (Figure 5).


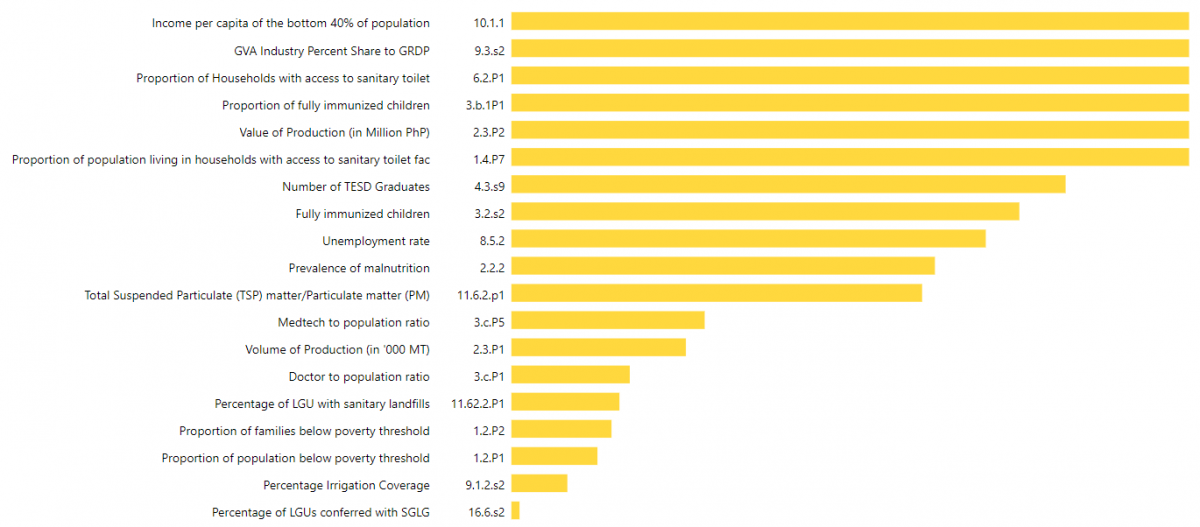
Figure 3. Progress Gap – Indicators on Track


Figure 4. Progress Gap – Indicators that Need Acceleration


There is a need to accelerate the current rate of progress to achieve the target. In Figure 4, the bar shows the magnitude of the gap between the predicted and target values of indicators that are not expected to hit the target by 2030. Moreover, Figure 5 shows the magnitude of the gap between the predicted and target values of indicators that are not expected to hit the target by 2030. The trend needs to be reversed to achieve the target.


Figure 5. Progress Gap – Indicators that are Regressing


SGD. ATTY. SHEILA O. DE GUZMAN
Regional Director, RSSO I