

Release Date :
Reference Number :
2024-39
Reference Period
1ST QUARTER 2024
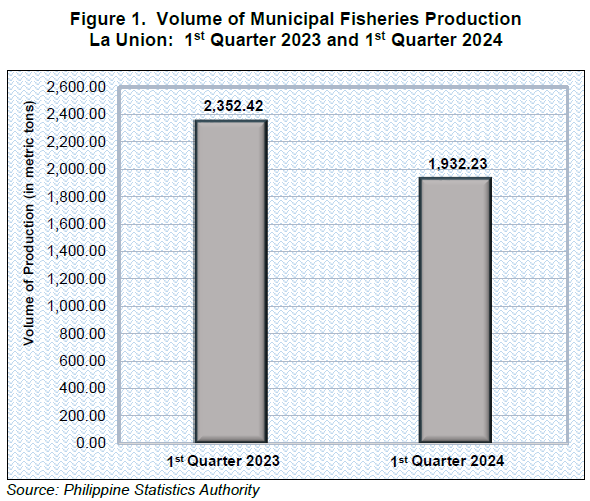
La Union’s municipal fisheries production decreases in 1st quarter 2024
The total municipal fisheries production in La Union went down by 17.86 percent from the estimated production of 2,352.42 metric tons in 1st quarter 2023 to 1,932.23 metric tons in 1st quarter 2024. (Figure 1)
Of the total volume of production for municipal fisheries, 93.93 percent came from marine municipal fisheries while 6.07 percent from inland municipal fisheries.
Marine Municipal
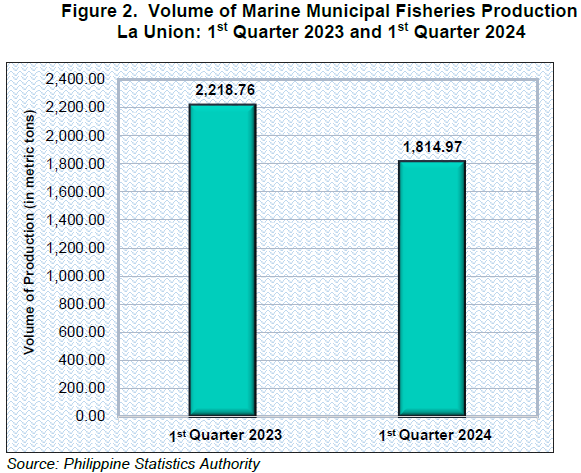
The volume of production from marine municipal fisheries dropped by 18.20 percent from 2,218.76 metric tons in 1st quarter 2023 to 1,814.97 metric tons in 1st quarter 2024. (Figure 2)
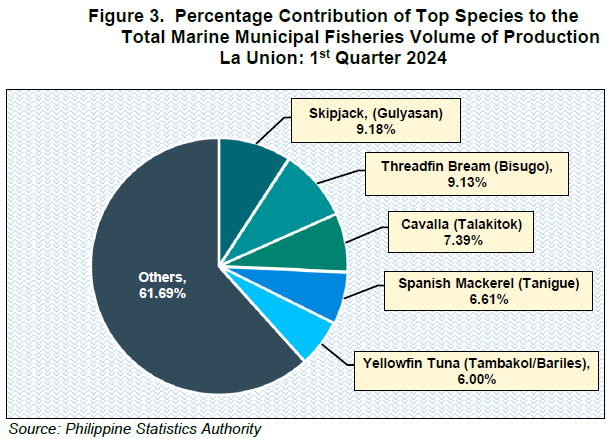
The dominant catch in marine municipal fisheries of the province in 1st quarter 2024 were Skipjack (Gulyasan) with 166.65 metric tons (9.18 percent share), Threadfin Bream (Bisugo) with 165.73 metric tons (9.13 percent share), Cavalla (Talakitok) with 134.09 metric tons (7.39 percent share), Spanish Mackerel (Tanigue) with 119.94 metric tons (6.61 percent share), and Yellowfin Tuna (Tambakol/Bariles) with 108.97 metric tons (6.00 percent share). (Figure 3)
Inland Municipal
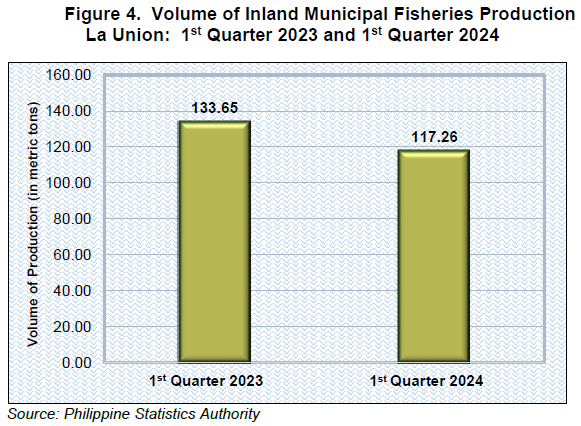
The volume of production from inland municipal fisheries went down by 12.26 percent from 133.65 metric tons in 1st quarter 2023 to 117.26 metric tons in 1st quarter 2024. (Figure 4)
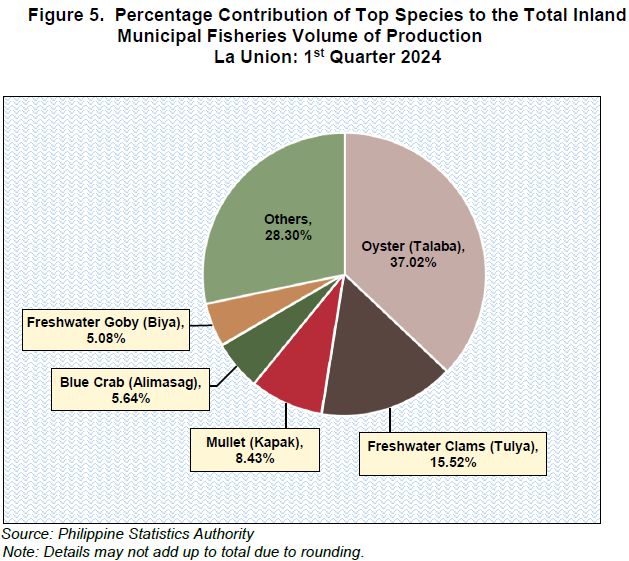
The top five major catch in the province in 1st quarter 2024 were Oyster (Talaba) with 43.41 metric tons (37.02 percent share), Freshwater Clams (Tulya) with 18.20 metric tons (15.52 percent share), Mullet (Kapak) with 9.89 metric tons (8.43 percent share), Blue Crab (Alimasag) with 6.61 metric tons (5.64 percent share), and Freshwater Goby (Biya) with 5.96 metric tons (5.08 percent share). (Figure 5)
Municipal fisheries data were gathered from administrative records of the Philippine Fisheries Development Authority (PFDA), Local Government Unit (LGU) - managed landing centers, and traditional landing centers.
TECHNICAL NOTES
Inland Municipal Fishing – the catching of fish, crustaceans, mollusks and other aquatic animals and plants in inland waters like lakes, rivers, dams, marshes, etc. using simple gears and fishing boats some of which are non-motorized with a capacity of less than three (3) gross tons, or fishing not requiring the use of fishing boats.
Landing Center is a place where the fish catch and other aquatic products are unloaded and traded. Traditional landing center is a type of landing center where fishermen could unload their catch and/or dock their fishing boats without any obligation or payment for the use of the place.
Quarterly Inland Fisheries Survey is a survey on volume and price of fish by species, caught by households engaged in inland fishing. It gathers quarterly data with monthly catch from sample fishing households. Respondents are fishermen or any knowledgeable member of the sample household.
Quarterly Municipal Fisheries Survey (Traditional Landing Center) – is a survey on volume and price of fish, by species, unloaded by fishing boats three (3) gross tons or less. It gathers quarterly data for the entire sample landing center with information on monthly fish unloading.
Quarterly Municipal Fisheries Survey (Philippine Fisheries Development Authority (PFDA), Local Government Units (LGUs), Privately-Managed Landing Centers) is gathering of data on volume and price of fish from administrative records of Philippine Fisheries Development Authority (PFDA) and Local Government Units (LGU)-managed landing centers. It is done on a quarterly basis with information from three (3) month period.
SGD. DANITES E. TEÑIDO, PhD
Chief Statistical Specialist
/MAQ/MFC
| Attachment | Size |
|---|---|
|
|
512.39 KB |