1. Annual Average Inflation
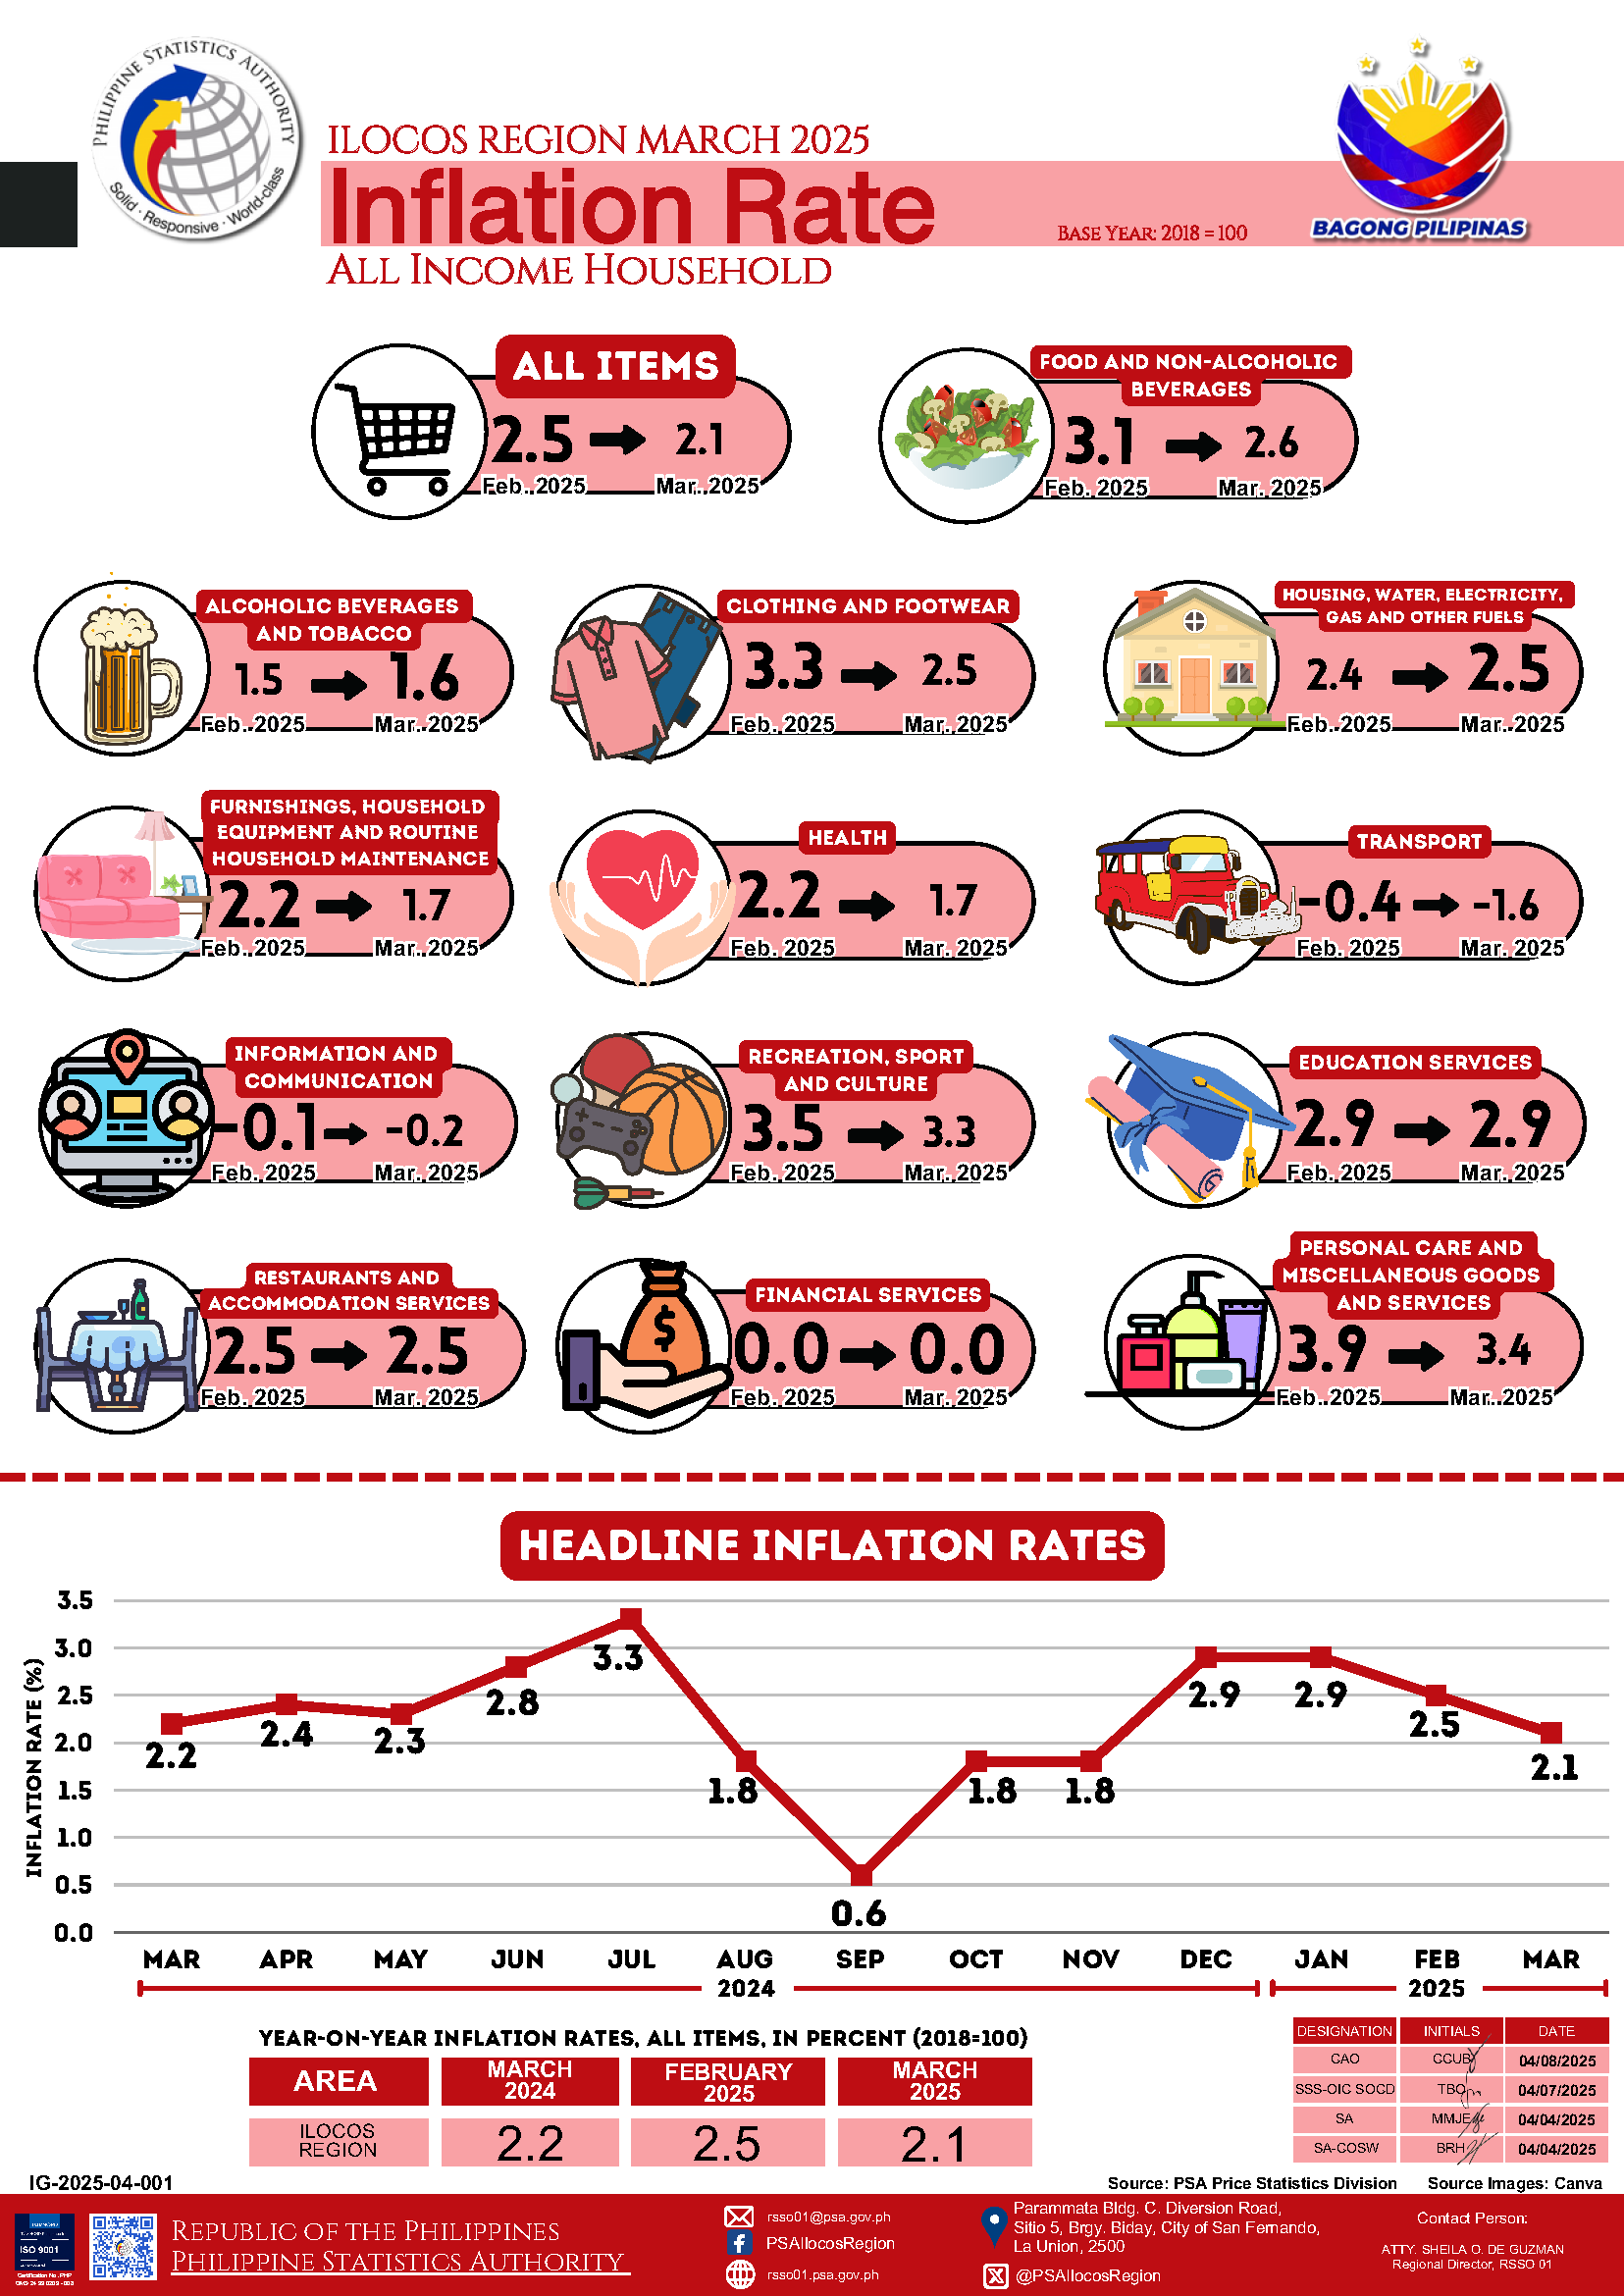
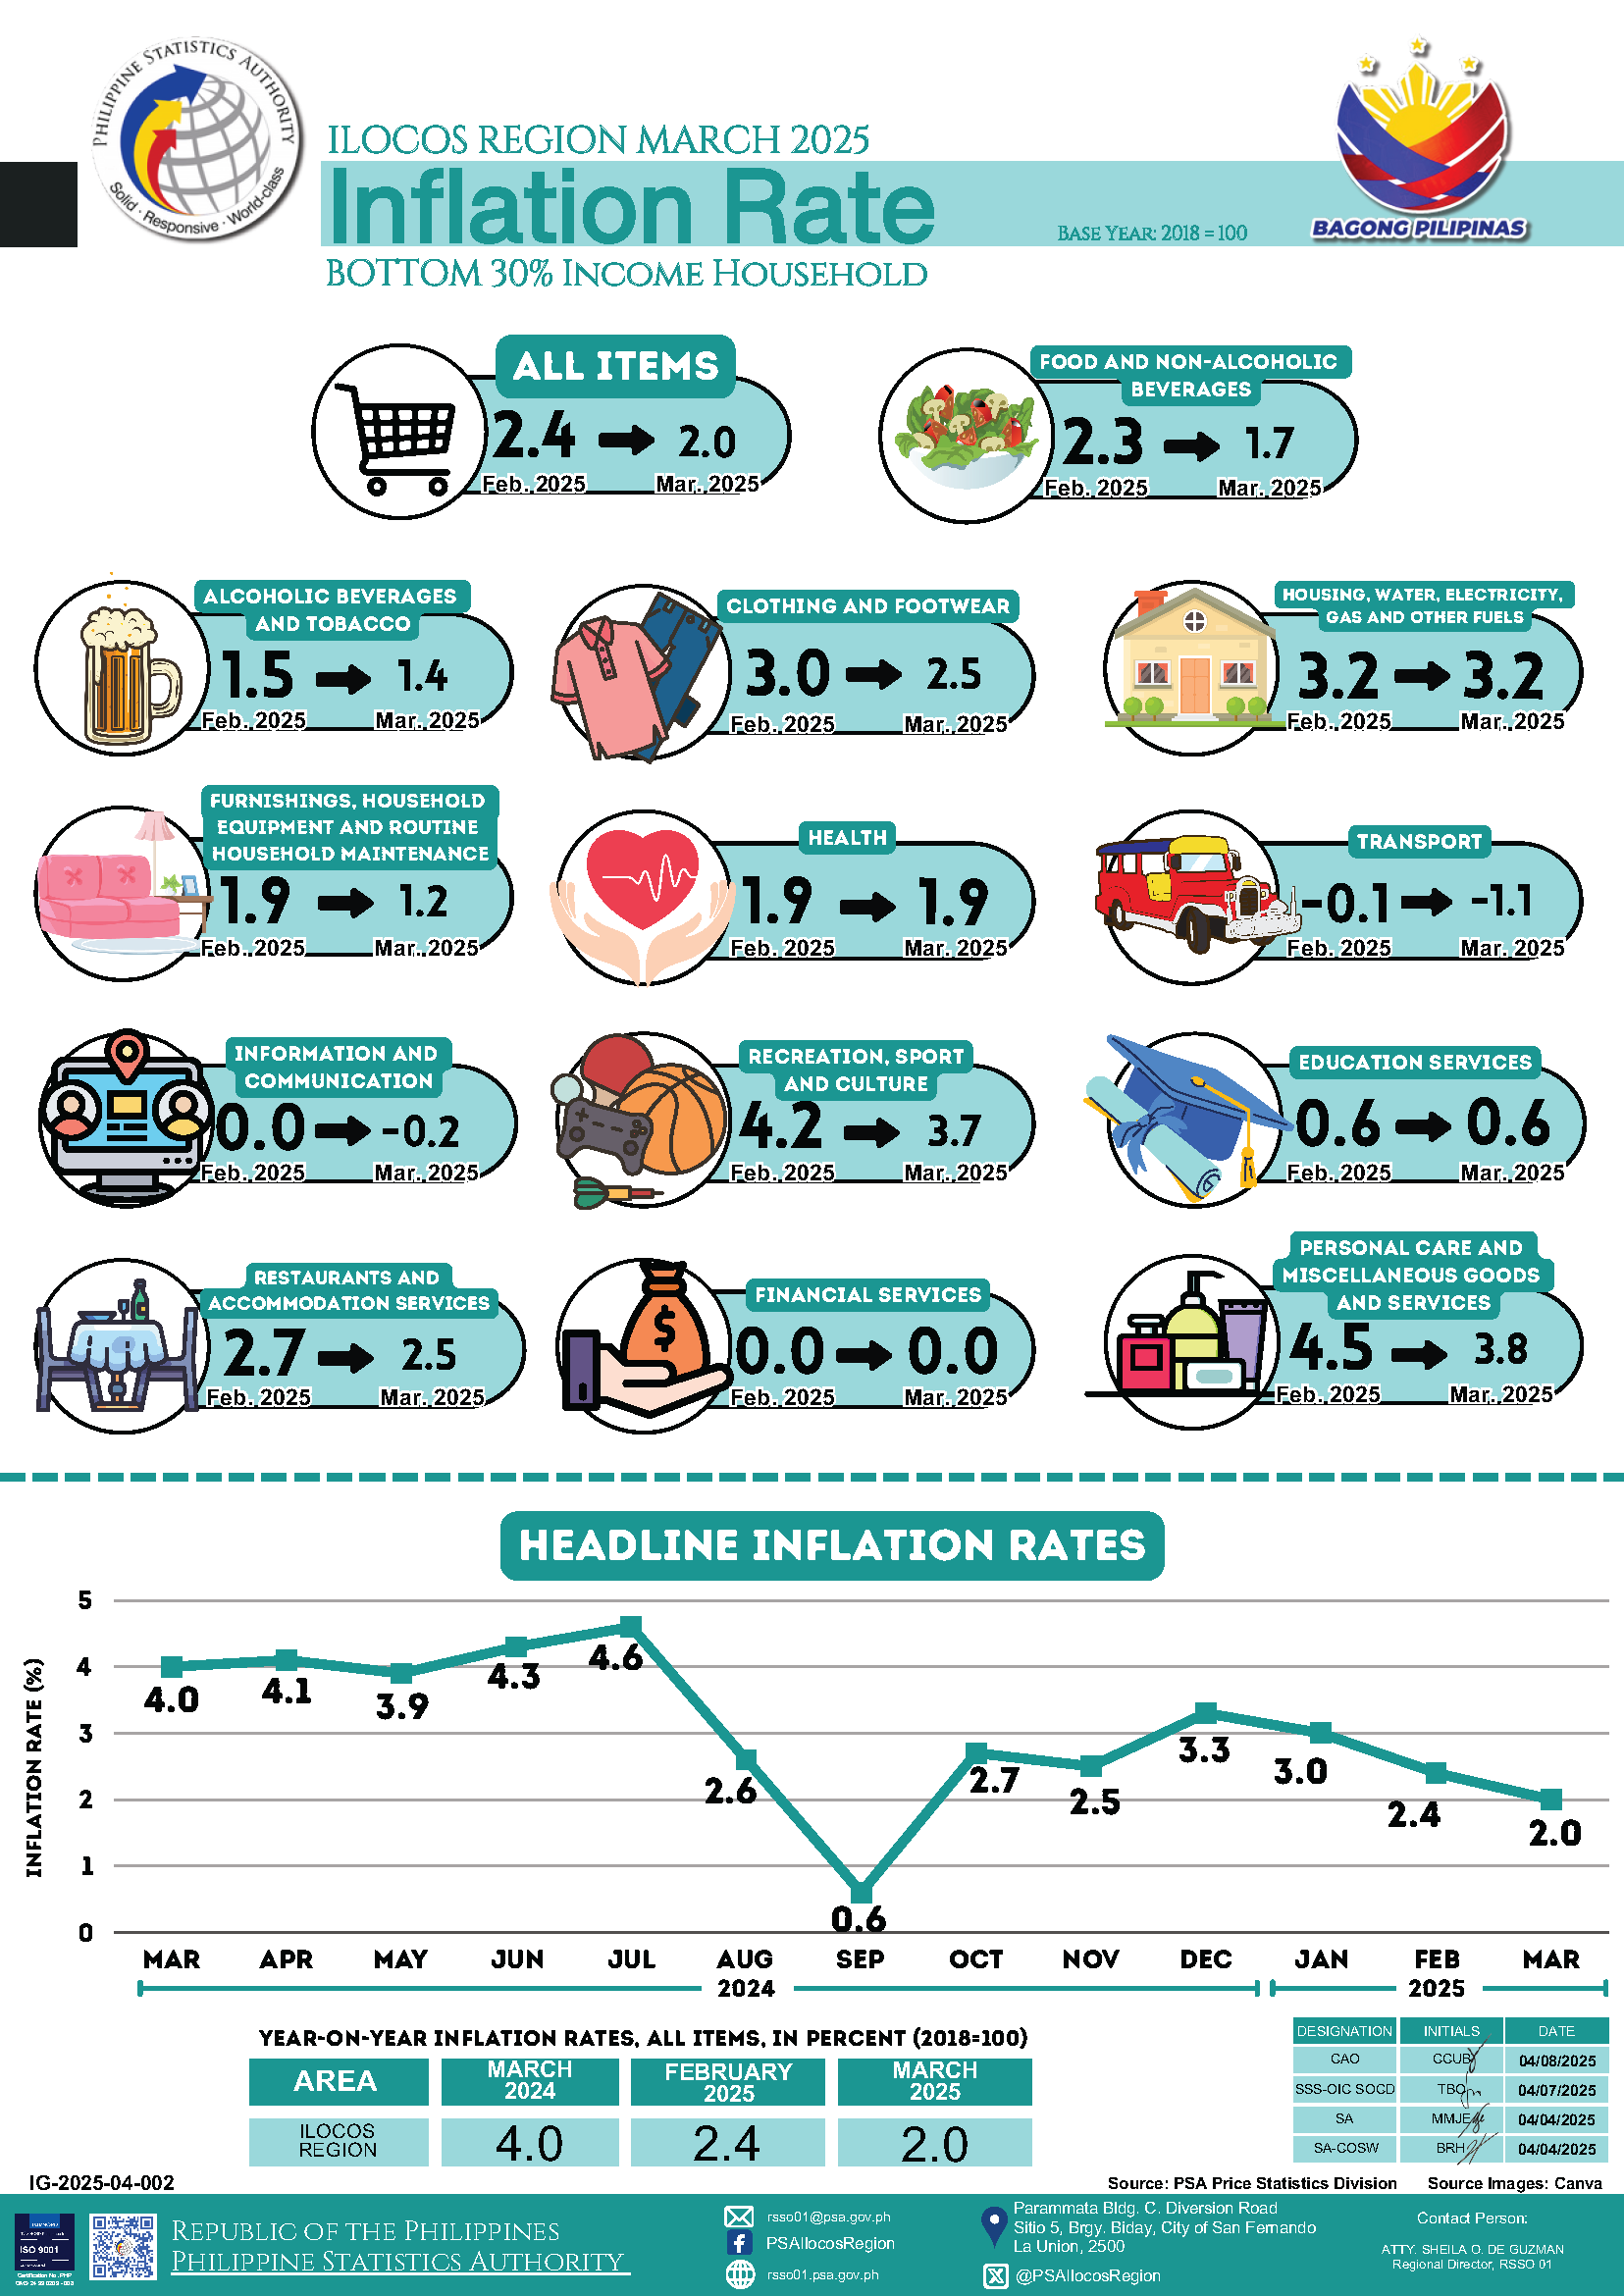
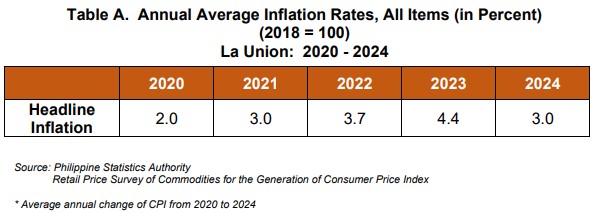
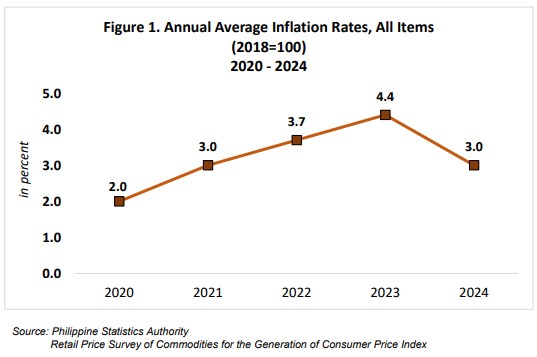
La Union’s annual average inflation rate for 2024 was recorded at 3.0 percent. This was lower compared with the 2023 annual average inflation rate of 4.4 percent.
1.1 Main Drivers to the Downward Trend of the 2024 Annual Average Inflation
The downtrend in the 2024 annual average inflation of the province was primarily influenced by the slower annual average increment in the index of food and non-alcoholic beverages at 5.7 percent in 2024 from 7.8 percent annual average inflation in 2023.
This was followed by housing, water, electricity, gas and other fuels with a slower annual average increase of 2.5 percent in 2024 from 3.8 percent annual average inflation in 2023. Transport index ranked third main contributor to the downtrend of 2024 annual average inflation in the province with a slower annual average mark up of 0.6 percent during the year from 2.5 percent annual average inflation in 2023.
In addition, the following commodity groups also recorded a slower year-on-year average inflation in 2024 compared with their respective previous year’s annual average rate:
Alcoholic beverages and tobacco, at 2.1 percent from 5.0 percent;
Clothing and footwear, at 1.7 percent from 3.7 percent;
Furnishings, household equipment and routine household maintenance, at 0.9 percent from 2.6 percent;
Health, at 1.2 percent from 2.2 percent;
Information and communication, at 0.3 percent from 1.3 percent;
Recreation, sport and culture, at 0.7 percent from 1.7 percent; and
Personal care, and miscellaneous goods and services, at 0.7 percent from 2.4 percent.
Financial services recorded an annual average decline of 0.1 percent in 2024 from zero percent in 2023.
In contrast, faster annual growth rate was observed in the education services at 1.9 percent in 2024 from an annual decrease of 0.2 percent in 2023. Higher inflation was also noted in restaurants and accommodation services at 0.2 percent in 2024 from zero growth in 2023.
1.2 Main Contributors to the 2024 Annual Average Inflation
The top three commodity groups contributing to the 2024 annual average inflation of the province were the following:
Food and non-alcoholic beverages with 72.9 percent share or 2.2 percentage points;
Housing, water, electricity, gas and other fuels with 15.7 percent share or 0.5 percentage point; and
Clothing and footwear with 2.0 percent share or 0.1 percentage point.
2. Annual Average Food Inflation
In 2024, the annual average food inflation at the provincial level was recorded at 6.1 percent, lower than the recorded annual average food inflation of 8.3 percent in 2023.
2.1 Main Drivers to the Downward Trend of the 2024 Annual Average Food Inflation
The deceleration of the annual average food inflation in the province in 2024 was primarily contributed by the annual average decrease of 4.5 percent in the vegetables, tubers, plantains, cooking bananas and pulses index from its annual average mark up of 24.4 percent in 2023. This was followed by fish and other seafood with a slower annual increase of 0.8 percent in 2024 from 9.1 percent in 2023. The third contributor to the downtrend of annual average food inflation in the province in 2024 was milk, other dairy products and eggs with a slower year-on-year average increase of 0.8 percent during the year from 10.4 percent annual average inflation in the previous year.
In addition, flour, bread and other bakery products, pasta products, and other cereals recorded a slower annual average increase of 2.8 percent in 2024 from 6.0 percent annual average inflation in 2023. Ready-made food and other food products not elsewhere classified also recorded slower annual average growth of 2.4 percent in 2024 from 3.6 percent annual average inflation in the previous year.
Moreover, oils and fats recorded an annual average decrease of 2.2 percent in 2024 from an annual average increase of 7.2 percent in 2023. Sugar, confectionery and desserts also recorded an annual average decrease of 4.2 percent in 2024 from a year-on-year average mark up of 18.8 percent in 2023.
In contrast, faster annual average gain were observed in the indices of rice at 22.2 percent in 2024 from 10.9 percent in 2023; and fruits and nuts at 7.5 percent annual average inflation in 2024 from 6.6 percent in 2023.
Furthermore, corn recorded an annual average increase of 15.2 percent in 2024 from an annual average decrease of 1.2 percent in 2023. Meat and other parts of slaughtered land animals also posted an annual average increment of 4.1 percent in 2024 from an annual average decline of 0.2 percent in 2023.
2.2 Main Contributors to the 2024 Annual Average Food Inflation
Food inflation contributed 71.5 percent or 2.1 percentage points to the overall annual average inflation in 2024. The top three food groups in terms of contribution to the 2024 annual average food inflation were the following:
Rice, with 82.3 percent share or 5.0 percentage points;
Meat and other parts of slaughtered land animals, with 12.6 percent share or 0.8 percentage points; and
Fruits and nuts, with 4.6 percent share or 0.3 percentage point.
SGD. DANITES E. TEÑIDO, PhD
Chief Statistical Specialist
La Union Provincial Statistical Office
/MMAAA