1. Headline Inflation
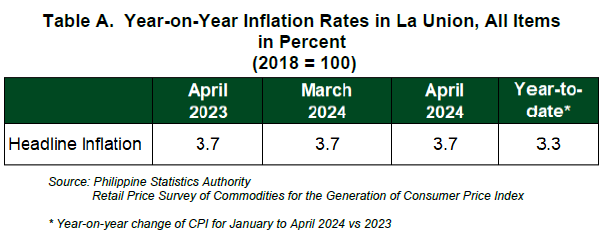
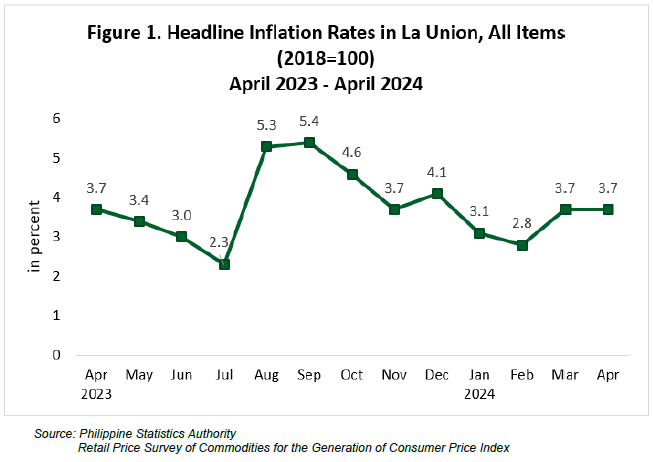
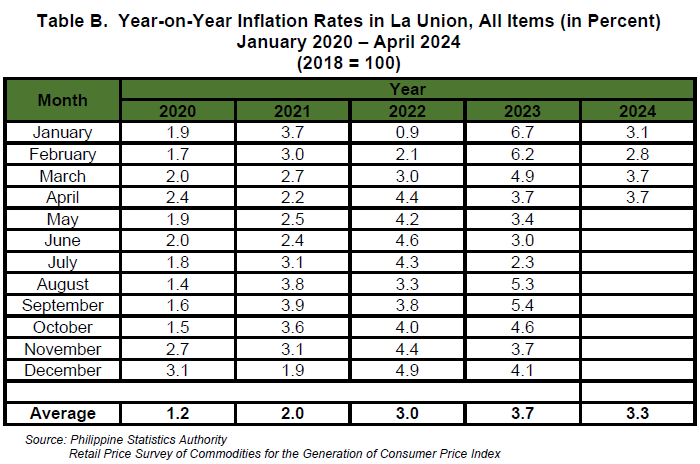
La Union’s headline inflation was posted at 3.7 percent in April 2024, the same inflation recorded in the province in March 2024. This brings the provincial average inflation from January to April 2024 at 3.3 percent. In April 2023, inflation rate was also posted at 3.7 percent. (Table A and Figure1)
1.1 Main Contributors to the Headline Inflation
The top three commodity groups contributing to the April 2024 overall inflation of the province were the following:
Food and non-alcoholic beverages with 72.7 percent share or 2.7 percentage points;
Housing, water, electricity, gas and other fuels with 15.3 percent share or 0.6 percentage point; and
Transport with 5.8 percent share or 0.2 percentage point.
2. Food Inflation
Food inflation at the provincial level slowed down to 7.4 percent in April 2024 from 8.2 percent in March 2024. In April 2023, food inflation was recorded at 7.0 percent.
2.1 Main Drivers to the Downtrend of Food Inflation
The deceleration of food inflation in the province in April 2024 was primarily contributed by the faster annual decline of 6.1 percent in the index of fish and other seafood from an annual drop of 2.6 percent in March 2024. This was followed by rice with a slower annual growth of 34.8 percent during the month from 36.3 percent in March 2024. The third contributor to the downtrend of food inflation in April 2024 was recorded in the index of meat and other parts of slaughtered land animals with a slower year-on-year mark-up of 1.2 percent during the month from 2.0 percent in March 2024.
Moreover, the index of fruits and nuts also recorded a slower annual increase of 9.7 percent in April 2024 from 13.2 percent in the previous month.
On the contrary, faster annual growth rates were observed in the indices of the following food groups during the month:
Flour, bread and other bakery products, pasta products, and other cereals, 2.4 percent from 2.3 percent;
Vegetables, tubers, plantains, cooking bananas and pulses, 6.3 percent from 2.4 percent; and
Ready-made food and other products not elsewhere classified, 1.2 percent from 1.1 percent.
Slower annual decline of 0.6 percent was observed in the index of milk, other dairy products and eggs in April 2024 from an annual decrease of 2.3 percent in March 2024. Similarly, oils and fats also recorded a slower annual drop of 1.8 percent in April 2024 from an annual decline of 4.7 percent in the previous month.
Meanwhile, the annual increase in the index of corn and annual decrease in sugar, confectionery and desserts remained at 17.9 percent and -5.0 percent, respectively.
2.2 Main Contributors to the Food Inflation
Food inflation contributed 71.5 percent or 2.6 percentage points to the overall inflation in April 2024. The top three food groups in terms of contribution to the food inflation during the month were the following:
Cereal and cereal products, which includes rice, corn, flour, bread and other bakery products, pasta products, and other cereals with 99.0 percent share or 7.3 percentage points;
Vegetables, tubers, plantains, cooking bananas and pulses with 5.2 percent share or 0.4 percentage point; and
Fruits and nuts, with 4.6 percent share or 0.3 percentage point.
SGD. DANITES E. TEÑIDO, PhD
Chief Statistical Specialist
/mmaaa