La Union’s CPI posted at 114.7 in February 2023
The Consumer Price Index (CPI) in La Union in February 2023 was recorded at 114.7. This means that on the average, prices of goods and services in the province have increased by 14.7 percent from the base year 2018. The province’s CPI was posted at 114.7 in January 2023 and at 108.0 in February 2022.
Meanwhile, Ilocos Region’s CPI was recorded at 111.7 and 121.0 in February 2022 and February 2023 respectively, higher than La Union’s CPI in said periods.
La Union’s inflation decelerates to 6.2% in February 2023
The annual headline inflation in La Union slowed down to 6.2 percent in February 2023, from 6.7 percent in January 2023. In February 2022, inflation was lower at 2.1 percent. The average inflation from January to February 2023 was recorded at 6.5 percent.

In 2022, the headline inflation in La Union was recorded at 0.9 percent in January. Inflation continued to accelerate in February, March, and April at 2.1 percent, 3.0 percent, and 4.4 percent, respectively. Inflation slowed down in May at 4.2 percent but moved at a faster rate in June at 4.6 percent. Inflation eased in July at 4.3 percent and decelerated further in August at 3.3 percent. Inflation accelerated in September at 3.8 percent and continued to climb in the last quarter of 2022 at 4.0 percent, 4.4 percent, and 4.9 percent in October, November, and December, respectively.
In January 2023, inflation in the province continued to move at a faster rate of 6.7 percent but slowed down in February 2023 at 6.2 percent.
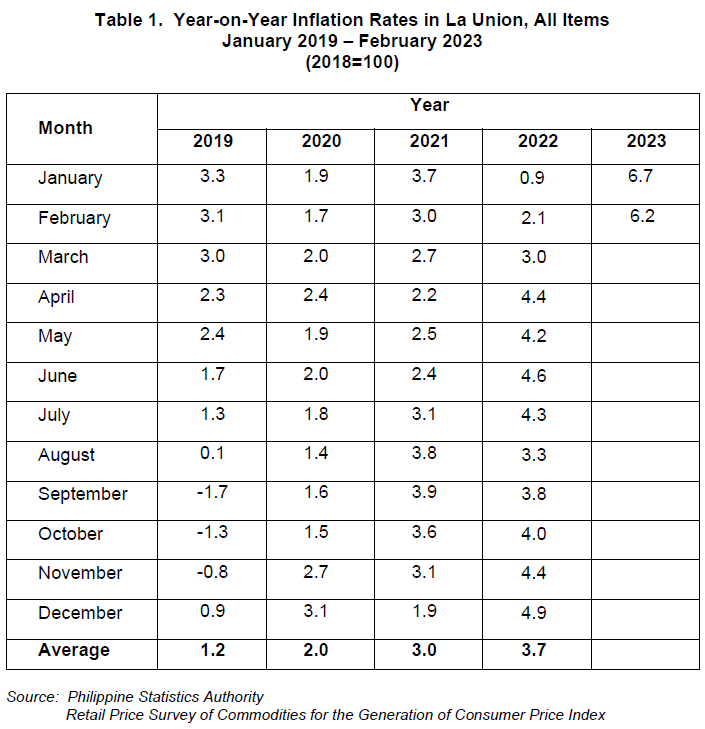
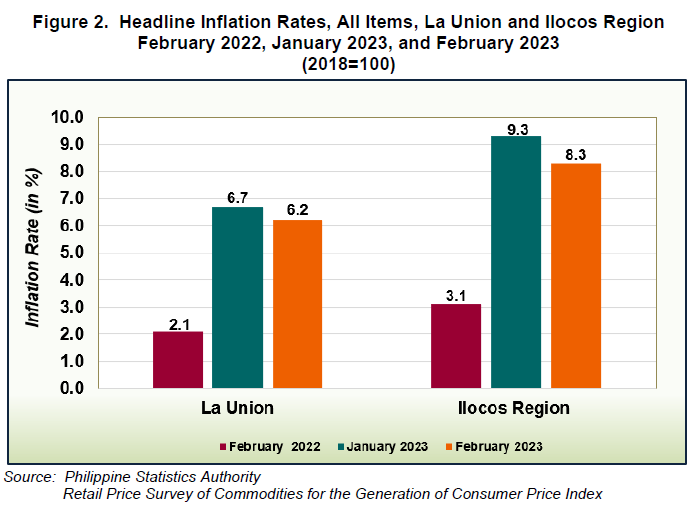
Similarly, Ilocos Region’s headline inflation decelerated to 8.3 percent in February 2023 from 9.3 percent in January 2023. In February 2022, inflation in the region was recorded at 3.1 percent.
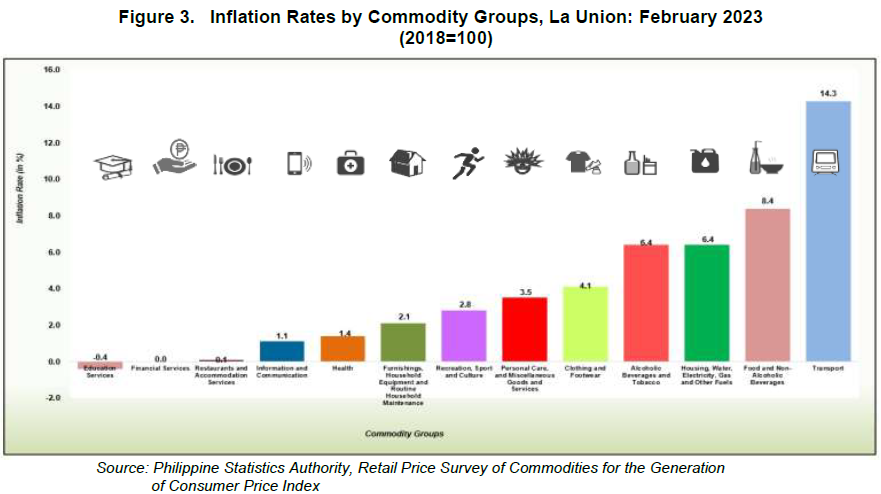
The slowdown of inflation in La Union in February 2023 was primarily brought about by the deceleration of the inflation rate in the index of the heavily weighted food and non-alcoholic beverages at 8.4 percent, from 9.0 percent in January 2023. Also contributed to the downtrend were: housing, water, electricity, gas and other fuels with inflation rate of 6.4 percent, from 7.5 percent; transport, with an inflation rate of 14.3 percent, from 16.3 percent; and restaurants and accommodation services with inflation rate of 0.1 percent, from 0.4 percent.
On the contrary, higher annual increases were observed in the following commodity groups in February 2023 than in the previous month:
Clothing and footwear, 4.1 percent;
- Information and communication, 1.1 percent;
- Recreation, sport and culture, 2.8 percent;
- Alcoholic beverages and tobacco, 6.4 percent;
- Furnishing, household equipment and routine household maintenance, 2.1 percent;
- Health, 1.4 percent; and
- Personal care and miscellaneous goods and services, 3.5 percent.
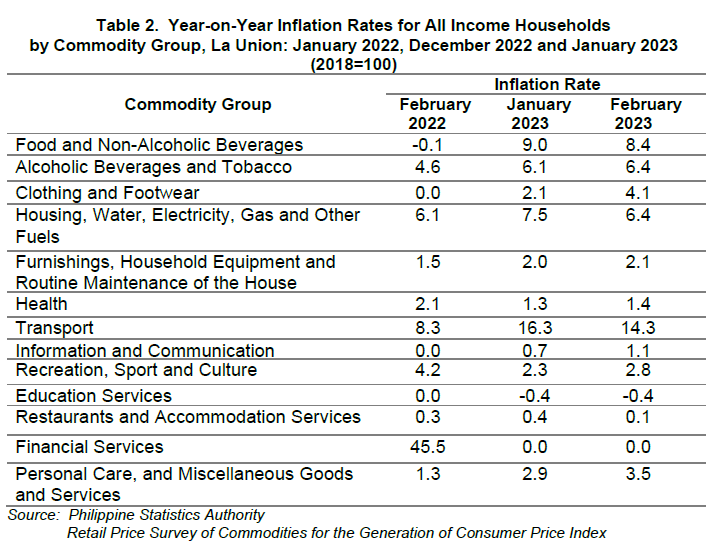
Meanwhile, the indices of education services and financial services remained at their previous month’s annual rates of -0.4 percent and 0.0 percent, respectively.
Similarly, food inflation at the provincial level slowed down to 8.8 percent in February 2023, from 9.4 percent in January 2023. In February 2022, food inflation was recorded at -0.3 percent.
Lower annual gains in the indices of vegetables, tubers, cooking bananas and pulses at 32.1 percent; fruits and nuts at 9.8 percent; and sugar, confectionery and desserts at 43.5 percent were the main contributors to the deceleration of food inflation in the province in February 2023.
Moreover, lower year-on-year mark-ups during the month were also noted in the indices of the following food groups:
Meat and other parts of slaughtered land animals, 4.6 percent;
Ready-made food and other food products not elsewhere classified (n.e.c), 5.9 percent; and
Oils and fats, 15.6 percent
On the contrary, higher annual growth rates were observed in the indices of the following food groups in February 2023:
Flour, bread and other bakery products, pasta products, and other cereals, 8.2 percent;
Fish and other seafood, 5.5 percent; and
Milk, other dairy products, and eggs, 14.4 percent.
Meanwhile, the indices of rice and corn continued to move at their respective previous month’s rates of 1.1 percent and 0.0 percent.
PPP in La Union remained at PhP0.87 in February 2023
The Purchasing Power of the Peso (PPP) in La Union remained at PhP0.87 in February 2023. The PPP of PhP0.87 means that the purchasing capability of PhP1.00 in 2018 decreased by 13 centavos in February 2023.
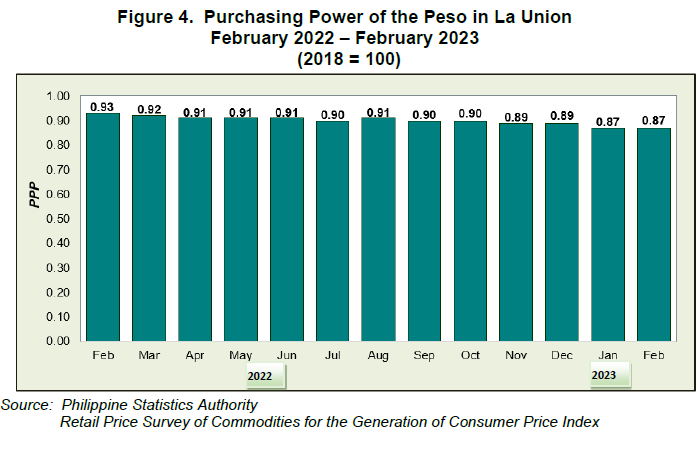
The January 2022 PPP in La Union was recorded at PhP0.93 and remained constant until February 2022. It went down to PhP0.92 in March 2022 and further decreased to PhP0.91 in April 2022. The PPP in the province remained at PhP0.91 in May 2022 and June 2022. The PPP decreased to PhP0.90 in July 2022 but increased in August 2022 at PhP0.91. It again went down to PhP0.90 in September 2022 and remained in October 2022. The PPP in the province decreased in November 2022 at PhP0.89 and remained in December 2022.
In January 2023, the PPP in the province decreased to PhP0.87 and remained until February 2023.
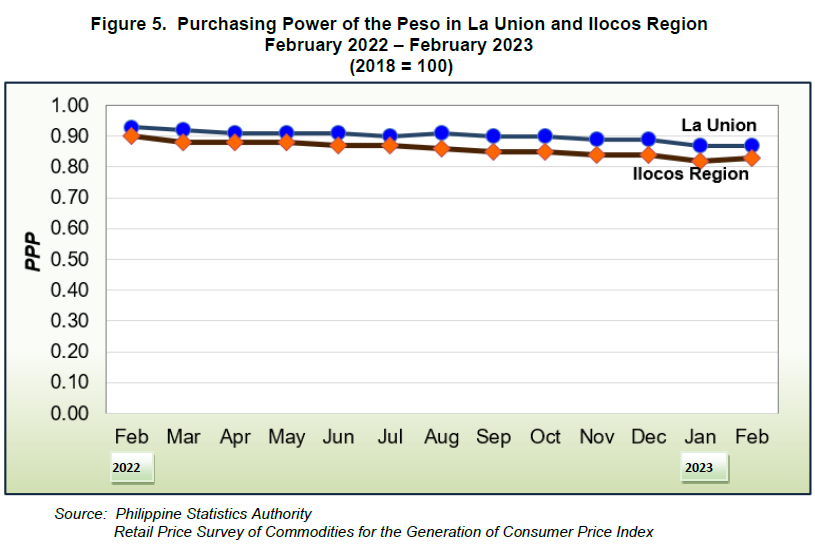
La Union’s PPP in February 2023 was higher than Ilocos Region’s PPP of PhP 0.83. The region’s PPP was posted at PhP0.82 in January 2023 and at PhP0.90 in February 2022.
TECHNICAL NOTES
The Philippine Statistics Authority (PSA) generates and announces the monthly Consumer Price Index (CPI) based on a nationwide survey of prices for a given basket of goods and services.
The CPI is an indicator of the change in the average prices of goods and services commonly purchased by consumers relative to a base year. It is most widely used in the calculation of inflation rate purchasing power of the peso (PPP). The CPI series also serve as basis for economic analysis, collective bargaining agreements, wage adjustments, and for monitoring the effects of government economic policy on households.
Inflation rate is defined as the annual rate of change or the year-on-year change in the CPI. On the other hand, the PPP is a measure of the real value of the peso in a given period relative to a chosen reference period.
Rebasing of CPI to Base Year 2018 and Adopting the Chained Laspeyres Formula in Index Computation
The PSA has rebased the CPI for all income households to base year 2018, from base year 2012. The methodology of rebasing the CPI to base year 2018 was approved by the PSA Board through the PSA Board Resolution No. 15 Series of 2021.
The PSA has started releasing the 2018-based CPI for All Income Households on 04 February 2022. The rebasing to 2018 is the 12th base period and the 11th rebasing for CPI. This was announced in Press Release Number 2022-01 dated 04 January 2022. The CPI series for all income households for January 2022 onwards shall be 2018-based.
1. Identification of the Base Year
Base period is a reference period, usually a year, at which the index number is set to 100. It is the reference point of the index number series. The CPI is rebased from base year 2012 to base year 2018.
The rebasing of the CPI is done periodically by the PSA due to the following: 1) to ensure that the CPI market basket continues to capture goods and services commonly purchased by households over time; 2) to update expenditure patterns of households; and 3) to synchronize its base year with 2018 base year of the Gross Domestic Product and other indices produced by PSA such as the Producer Price Index (PPI) for Agriculture; PPI for Manufacturing; and Value of Production Index (VaPI), Volume of Production Index (VoPI), and Value of Net Sales Index (VaNSI) for Manufacturing.
The year 2018 was chosen as the next base year because it was the latest year when the Family Income and Expenditure Survey (FIES) results were made available. It is also in accordance with PSA Board Resolution No. 1, Series of 2017-146, which approved the synchronized rebasing of the price indices to base year 2006 and every six (6) years thereafter.
2. Determination of the Market Basket
Market basket refers to a sample of goods and services commonly purchased by the households.
Determining the right market basket is crucial because inadequate representation of the typical basket will give wrong signals as to the behavior of prices, a very important factor in economic planning.
The market basket for the CPI for All Income Households is updated using the results of the 2021 Survey of Key Informants (SKI). The survey, which was undertaken in March 2021, was conducted nationwide to store managers store managers, sellers, or proprietors in order to obtain information on the most commonly purchased goods and availed of services by the households.
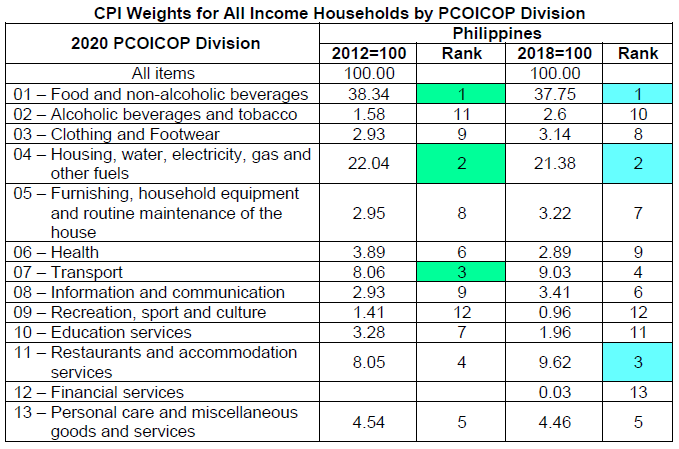
The commodities in the 2018-based CPI market basket are grouped according to the 2020 Philippine Classification of Individual Consumption According to Purpose (PCOICOP) which is based on the United Nations COICOP.
3. Determination of the Household Consumption Patterns (Weights)
This activity involves assigning weights to the commodity groups/sub-groups. This reflects the consumption priorities of households and the way they allocate resources to meet their needs. Weight is a value attached to a commodity or group of commodities to indicate the relative importance of that commodity or group of commodities in the market basket.
The weights for the 2018-based CPI were derived from the expenditure data of the 2018 FIES. The weight for each item of expenditure is the proportion of the expenditure of commodity/group of commodities to the total national expenditure. The sum of the weights of the commodity groups at the national level is equal to 100.
The table below shows the comparison of the expenditure weights between the 2012 and 2018-based CPI for the Philippines.
4. Monitoring of Prices of Items in the Market Basket
This involves establishing baseline information for prices of the items in the base year and monitoring the prices of the items on a regular basis. Collection of data for the CPI is done by the provincial staff of the PSA. Except for food, beverage and tobacco (FBT) in the National Capital Region (NCR) and petroleum products which are monitored on a weekly basis, price collection is generally done twice a month. First collection phase is done in the first five days of the month while the second phase is on the 15th to 17th day of the month. Data are collected from the sample outlets (outlets or establishments where prices of commodities/services are collected or quoted) which were chosen using the following criteria:
Popularity of an establishment along the line of goods to be priced – this means the sample outlet is publicly noted in the locality for selling goods included in the CPI market basket and the outlet is patronized by a large segment of the population.
Consistency and completeness of stock
Consistency of stock – the outlet has a constant, steady or regular stock of commodities listed in the CPI price collection forms as well as of those commodities of the same kind and belonging to the same commodity group.
Completeness of stock – the sample outlet carries in its stock many if not all of the items included in the CPI price collection forms relative to the other outlets in the area.
Permanency of outlet – the outlet is an established store or stall in the market area. It should not be an ambulant or transient vendor in order that the collection of data can be done for the succeeding survey rounds.
Geographical location – the outlet is conveniently located and is accessible to the majority of consumers in the area.
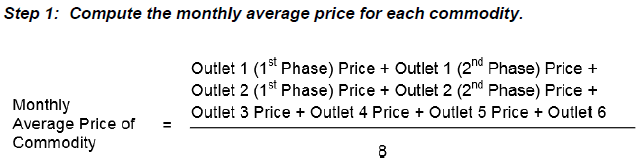
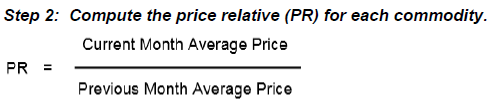
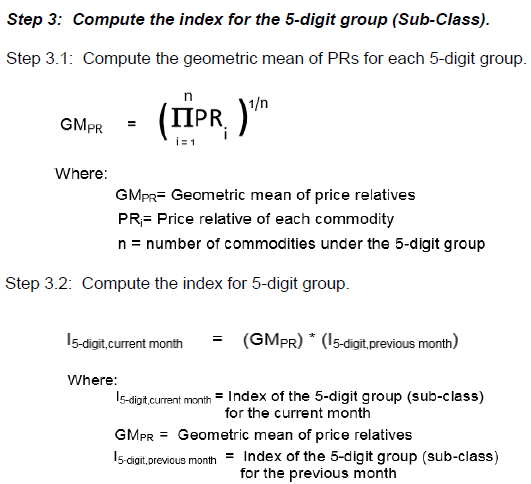
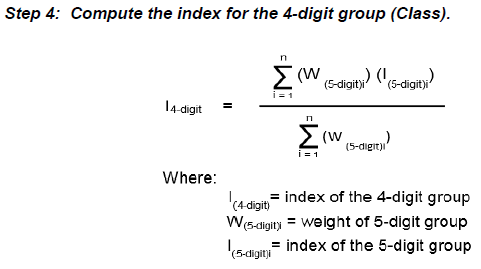
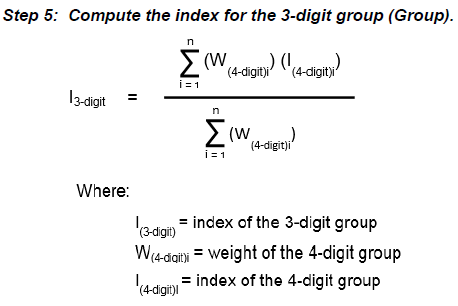
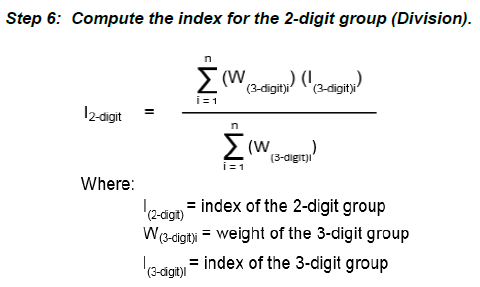
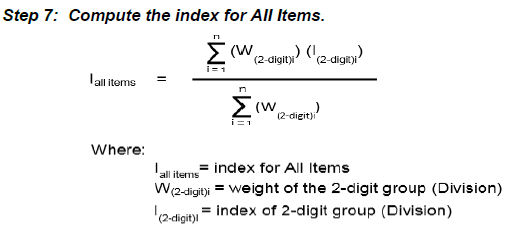
5. Index Computation
The 2018-based CPI series uses the same method of computation as the 2012-based CPI series, which is the chained Laspeyres formula.
The PSA employed the weighted arithmetic mean of price relatives and the “Chain” method to provide timely indicators since this method allows the inclusion or exclusion of commodities in the market basket to address the changing consumer taste and preferences and technological changes. Below are the steps in the computation of CPI using the 2018 as the base year:
6. Dissemination of Reports
Data are available five days after the reference month which are posted at the PSA website (www.psa.gov.ph). Data series are also uploaded at the OpenSTAT database portal of the PSA website.
Economic Indicators Derived from the CPI
Two important indicators, the inflation rate and PPP, are derived from the CPI which are important in monitoring price stability and the value of the country’s currency.
Inflation Rate is the annual rate of change or the year-on-year change of the CPI expressed in percent. The formula is:
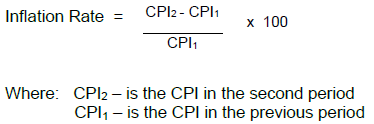
Headline Inflation is the rate of change in the weighted average prices of all goods and services in the CPI basket while Core Inflation refers to the rate of change in the CPI that excludes the following item/commodity groups: rice, corn, fruits and vegetables, and fuel items
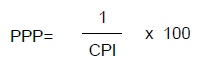
The PPP measures the real value of the peso in a given period relative to a chosen reference period. It is computed by getting the reciprocal of the CPI and multiplying the result by 100.
SGD. DANITES E. TEÑIDO, PhD
Chief Statistical Specialist
/MMAAA