1. Headline Inflation
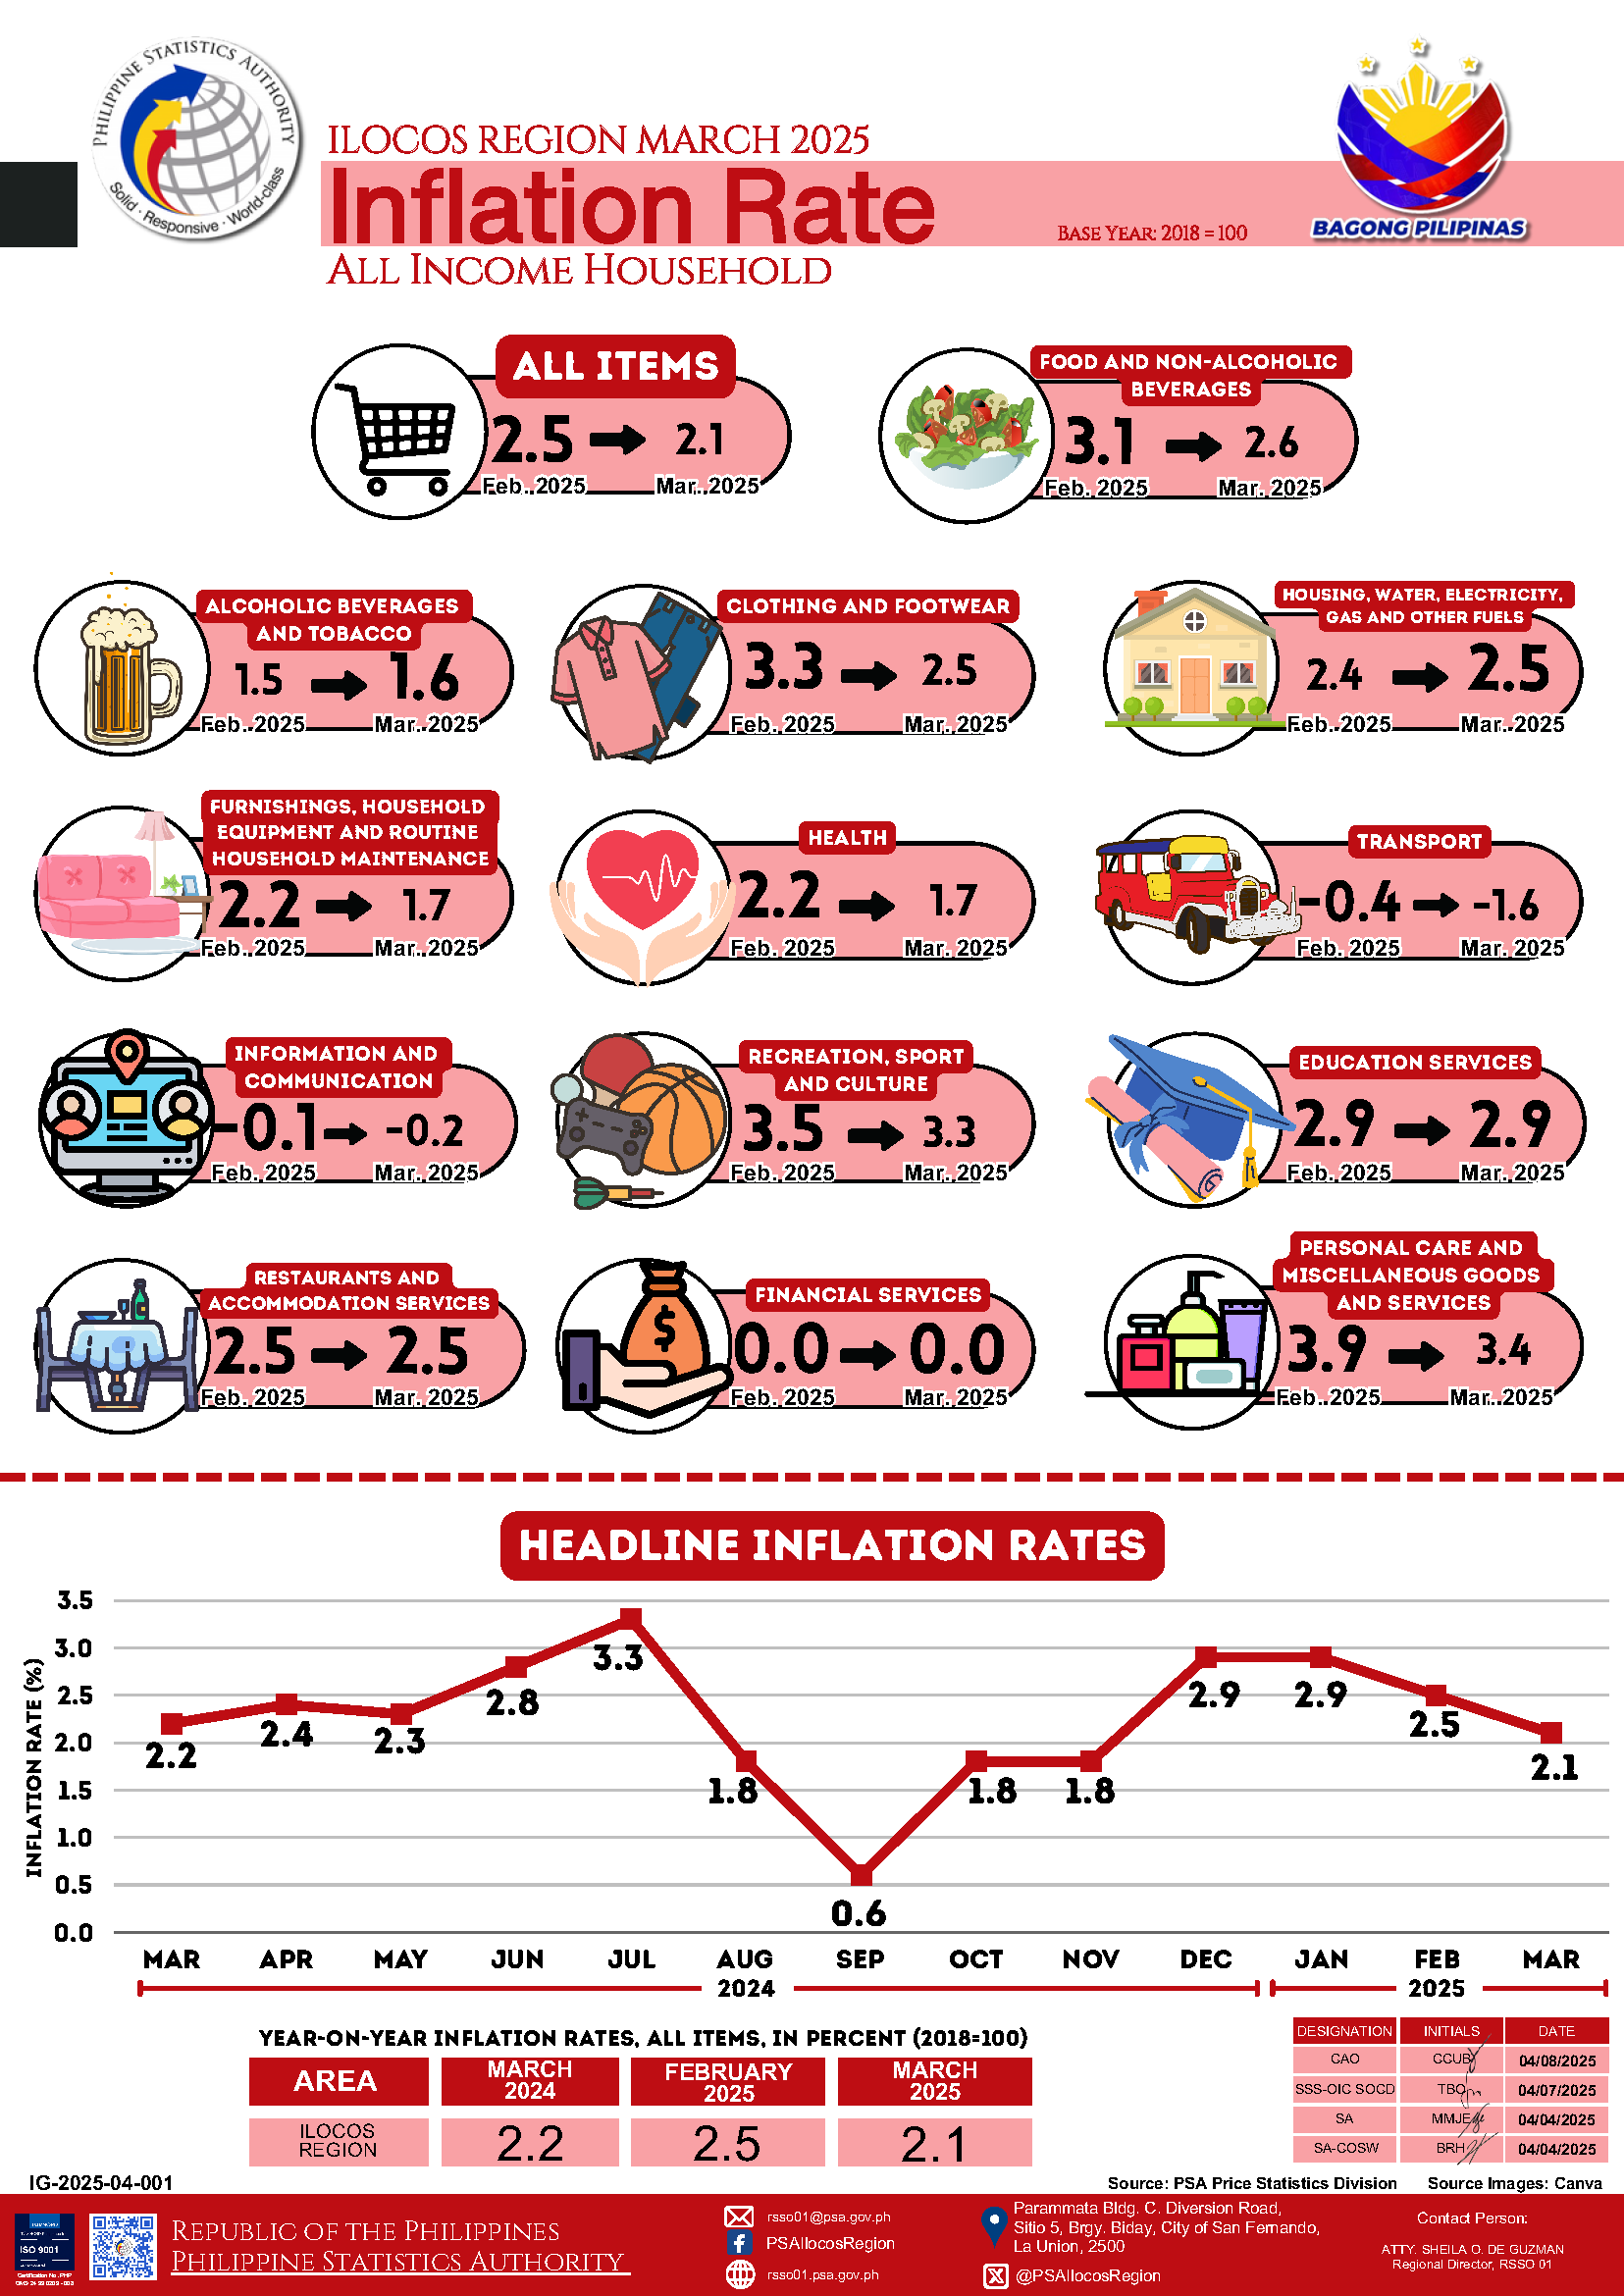
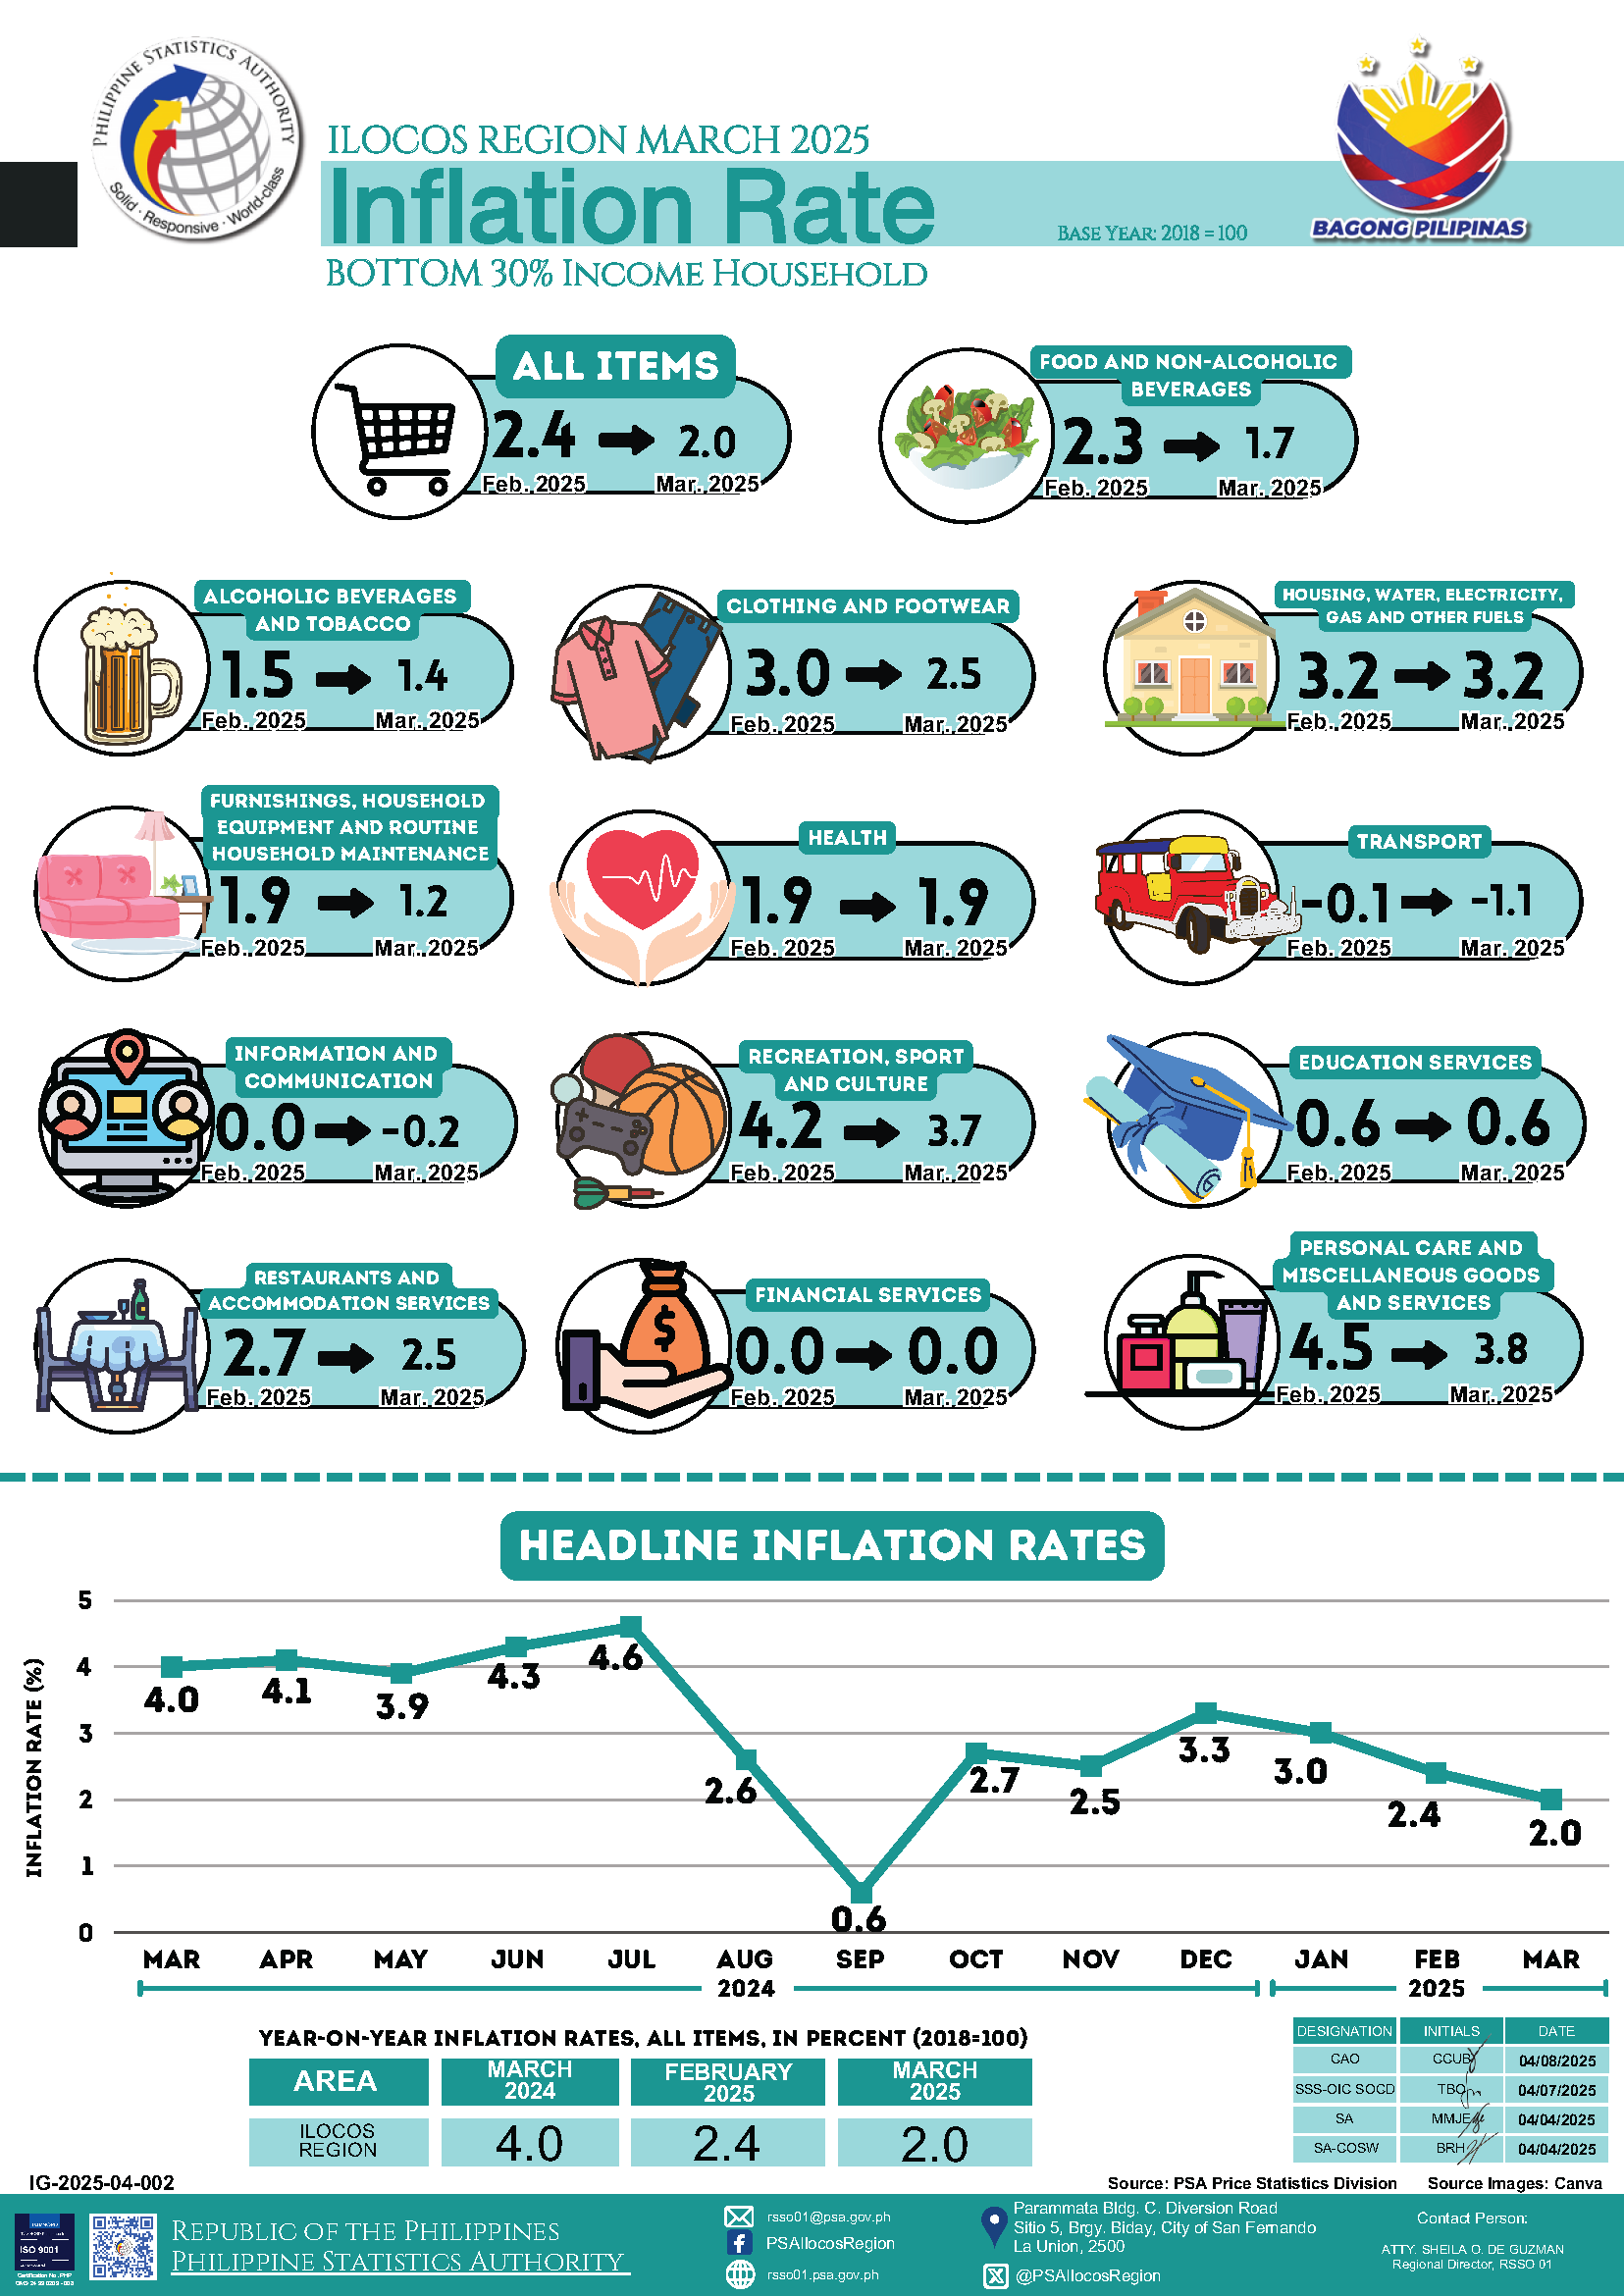
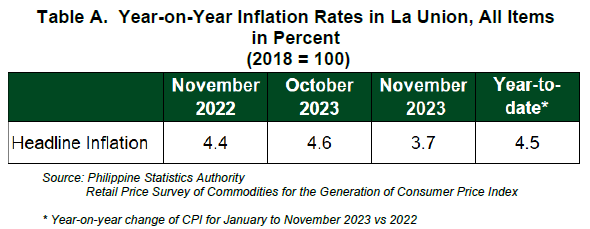
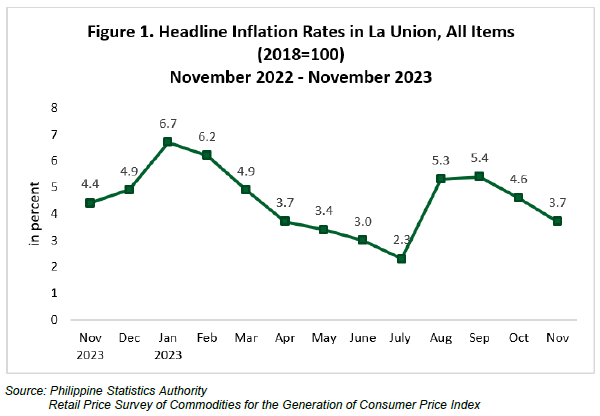
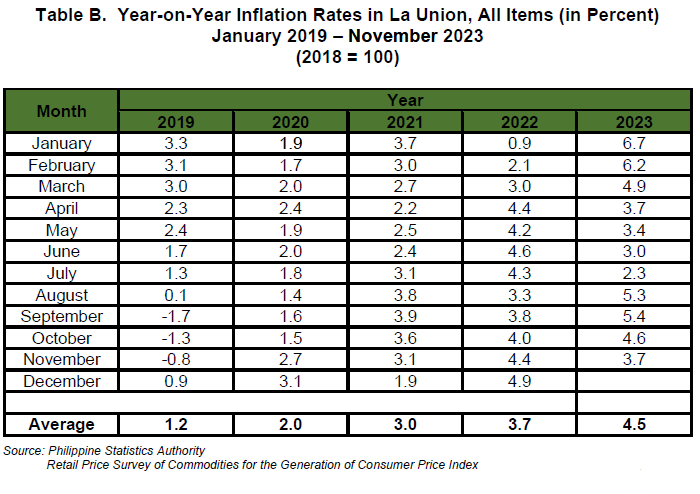
La Union’s headline inflation eased further to 3.7 percent in November 2023 from 4.6 percent in October 2023. This brings the provincial average inflation rate from January to November 2023 to 4.5 percent. In November 2022, inflation rate was higher at 4.4 percent. (Table A and Figure1)
1.1 Main Drivers to the Downtrend of the Headline Inflation
The downtrend in the inflation of the province in November 2023 was primarily brought about by the slower year-on-year inflation in the index of housing, water, electricity, gas and other fuels at 1.5 percent from 5.1 percent in October 2023.
This was followed by food and non-alcoholic beverages with a slower annual growth of 8.0 percent in November 2023 from 8.4 percent in October 2023. The third main contributor to the downtrend of the headline inflation of the province was transport, with -0.6 percent inflation in November 2023 from 0.2 percent in the previous month.
In addition, slower annual increases were also noted in the following indices of the following commodity groups during the month:
Health,1.7 percent from 2.2 percent;
Personal care and miscellaneous goods and services,1.5 percent inflation from 1.7 percent;
Furnishings, household equipment and routing household maintenance, 2.6 percent inflation from 2.8 percent; and
Alcoholic beverages and tobacco, 4.1 percent inflation from 4.2 percent.
Meanwhile, the indices of the following commodity groups retained their respective previous month’s annual inflation rates:
Clothing and footwear, 3.8 percent;
Information and communication, 1.4 percent;
Recreation, sport and culture, 0.8 percent;
Education services, 0.0 percent;
Restaurants and accommodation services, 0.0 percent; and
Financial services, 0.0 percent.
1.2 Main Contributors to the Headline Inflation
The tops three commodity groups contributing to the November 2023 overall inflation were the following:
Food and non-alcoholic beverages with 80.9 percent share or 3.0 percentage points;
Housing, water, electricity, gas and other fuels with 7.5 percent share or 0.3 percentage points; and
Clothing and footwear with 3.5 percent share or 0.1 percentage points.
2. Food Inflation
Food inflation at the provincial level slowed down further to 8.7 percent in November 2023 from 8.9 percent in October 2023. In November 2022, food inflation was lower at 4.7 percent.
2.1 Main Drivers to the Downward Trend of Food Inflation
The deceleration of food inflation of the province in November 2023 was primarily contributed by lower annual increment in the index of vegetables, tubers, cooking bananas and pulses at 11.8 percent from 40.9 percent in October 2023. This was followed by sugar, confectionery and desserts with an inflation rate of -2.6 percent during the month from 2.0 percent in October 2023. The third contributor to the downtrend of food inflation in November 2023 was the lower annual gain in the index of flour, bread and other bakery products, pasta products, and other cereals at 4.3 percent during the month, from 4.7 percent in the previous month.
The following food groups also exhibited lower inflation during the month compared with their previous month’s inflation rates:
Corn, -6.1 percent from 0.0 percent; and
Oils and fats, 2.4 percent from 2.7 percent;
In contrast, higher annual inflation rates during the month were noted in the indices of the following food groups:
Rice, 26.1 percent from 16.6 percent;
Meat and other parts of slaughtered land animals, -1.7 percent from -1.8 percent;
Fish and other seafood, 7.8 percent from 6.6 percent;
Milk, other dairy products, and eggs, 5.4 percent from 4.7 percent;
Fruits and nuts, at 12.5 percent from 8.2 percent; and
Ready-made food and other food products not elsewhere classified, 1.7 percent from 1.5 percent.
2.2 Main Contributors to the Food Inflation
Food contributed 79.6 percent or 3.0 percentage points to the overall inflation in November 2023. The food groups with the highest contribution to food inflation during the month were the following:
Cereal and cereal products, which includes rice, corn, flour, bread and other bakery products with 72.3 percent share or 6.3 percentage points;
Fish and other seafood, with 11.6 percent share or 1.0 percentage points; and
Vegetables, tubers, cooking bananas and pulses with 9.2 percent share or 0.8 percentage points.
SGD. DANITES E. TEÑIDO, PhD
Chief Statistical Specialist
/MMAAA