

Release Date :
Reference Number :
2023-10
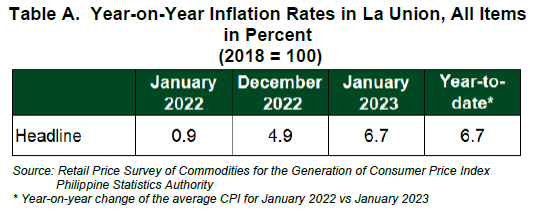
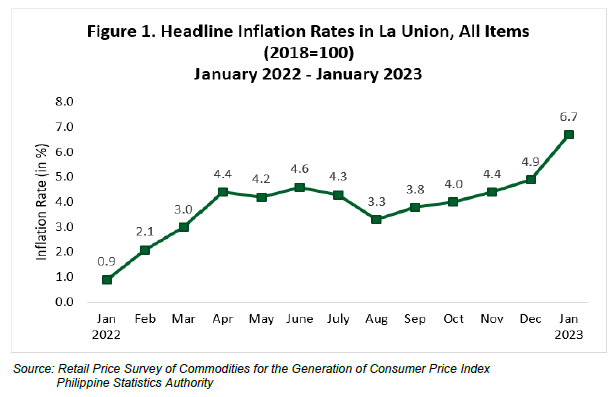
Headline inflation in La Union continued its uptrend as it accelerated further to 6.7 percent in January 2023, from 4.9 percent in December 2022. In January 2022, inflation stood at 0.9 percent. (Table A and Figure 1)
The acceleration of inflation in La Union in January 2023 was primarily brought about by the higher annual mark-up in the index of the heavily weighted food and non-alcoholic beverages at 9.0 percent, from 5.9 percent in December 2022. This was followed by housing, water, electricity, gas and other fuels with inflation rate of 7.5 percent, from 5.7 percent in the previous month. Transport, with an inflation rate of 16.3 percent, from 15.0 percent in December 2022, was the third highest contributor to the uptrend of inflation in the province.
Higher annual increments were also noted in the following commodity groups in January 2023 than in the previous month:
-
Clothing and footwear, 2.1 percent;
-
Alcoholic beverages and tobacco, 6.1 percent;
-
Information and communication, 0.7 percent;
-
Furnishings, household equipment and routine household maintenance, 2.0 percent; and
-
Recreation, sport and culture, 2.3 percent.
On the contrary, lower annual increase was observed in the index of personal care, and miscellaneous goods and services at 2.9 percent in January 2023, from 3.1 percent in December 2022. Slower annual growth rate was also noted in the index of health at 1.3 percent in January 2023, from 1.5 percent in the previous month.
Meanwhile, the indices of education services; restaurants and accommodation services; and financial services remained at their previous month’s annual rates of -0.4 percent, 0.4 percent, and 0.0 percent, respectively.
Food inflation at the provincial level climbed to 9.4 percent in January 2023, from 5.9 percent in December 2022. In January 2022, food inflation was recorded at -2.2 percent.
Higher year-on-year increases in the indices of rice at 1.1 percent; meat and other parts of slaughtered land animals at 4.9 percent; and fish and other seafood at 5.2 percent were the main contributors to the acceleration of food inflation in the province in January 2023.
.
Moreover, higher year-on-year mark-ups during the month were also noted in the indices of the following food groups:
-
Milk, other dairy products, and eggs, 12.9 percent;
-
Fruits and nuts, 12.4 percent;
-
Flour, bread and other bakery products, pasta products, and other cereals,
8.0 percent;
-
Oils and fats, 16.5 percent; and
-
Ready-made food and other food products not elsewhere classified (n.e.c),
6.8 percent.
On the contrary, lower annual growth rates were observed in the indices of the following food groups in January 2023:
-
Corn, 0.0 percent;
-
Vegetables, tubers, cooking bananas and pulses, 34.9 percent; and
-
Sugar, confectionery and desserts, 45.7 percent.
SGD. DANITES E. TEÑIDO, Ph.D.
Chief Statistical Specialist
/MMAAA