

Release Date :
Reference Number :
2019-20
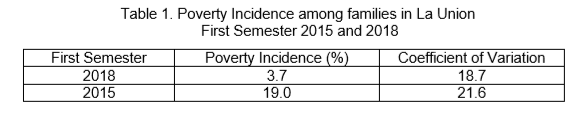
Poverty incidence in La Union dropped to single digit in first semester 2018
The poverty incidence among Filipino families in La Union in the first semester of 2018 was estimated at 3.7 percent. This figure is relatively low as it went down to a single digit from its double digit level in first semester 2015 at 19.0 percent. This is the proportion of families whose income is below the poverty line to the total number of families.
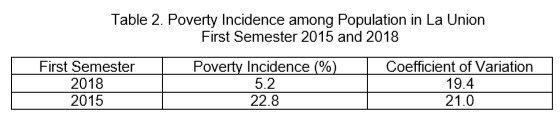
On the other hand, the poverty incidence among Filipino individuals in La Union in the first semester of 2018 estimated at 5.2 percent was lower than the recorded poverty incidence among Filipinos in first semester of 2015 at 22.8 percent. This is referred to as the proportion of the population living below the poverty line to the total population.
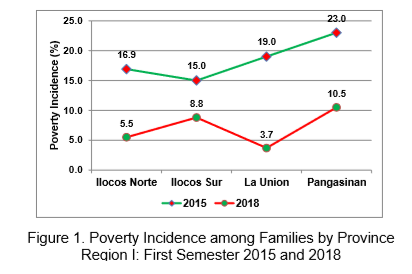
La Union has the lowest poverty incidence among families in Region I during the first semester of 2018
Of the four provinces of Region I, La Union has the lowest poverty incidence among families in first semester of 2018 at 3.7 percent. It was followed by Ilocos Norte and Ilocos Sur with 5.5 percent and 8.8 percent respectively. Pangasinan maintained its two digit poverty incidence but it dropped to 10.5 percent from the recorded poverty incidence in 2015 of 23.0 percent.
Similarly, La Union has the lowest poverty incidence among individuals in Region I in first semester 2018 computed at 5.2 percent. Ilocos Norte and Ilocos Sur followed closely at 7.6 and 11.1 percent respectively. Pangasinan has the highest with 14.3 percent.
Compared with the figures in first semester of 2015, poverty incidence in all four provinces of Ilocos Region went down.
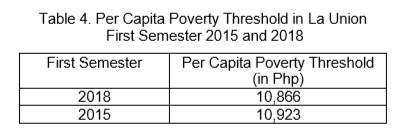
Food and Poverty Thresholds
In first semester 2018, a family of five living in La Union needed no less than Php6,316, on the average, to meet the family’s basic food needs for a month. This is referred to as the food threshold. This amount is 0.72 percent lower than the food threshold in first semester 2015.

Likewise, no less than Php9,055, on the average, was needed to meet both the basic food and non-food needs of a family of five in a month in first semester 2018. This is called the poverty threshold. It is lower by 0.52 percent than the estimated amount on the same period in 2015.
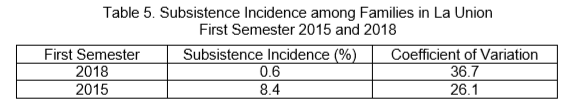
The subsistence incidence among Filipino families in La Union was estimated at 0.6 percent in the first semester of 2018. This refers to the proportion of Filipino families whose income fall below the food threshold. In the same period in 2015, the proportion of families who are food poor in La Union was calculated at 8.4 percent.
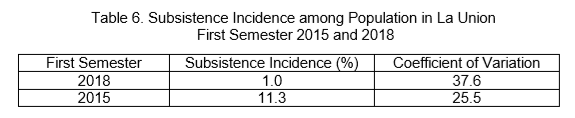
On the other hand, the proportion of Filipino individuals in La Union whose income fall below the food threshold was estimated at 1.0 in first semester of 2018 from 11.3 percent in first semester of 2015. This is otherwise known as the subsistence incidence among Filipino individuals.
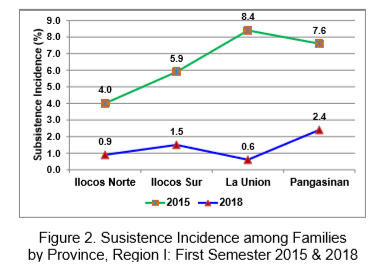
Regionwide, La Union had the lowest subsistence incidence in first semester 2018 at 0.6 percent. Ilocos Norte and Ilocos Sur ranked second and third with 0.9 percent and 1.5 percent respectively. Pangasinan had the highest subsistence incidence at 2.4 percent.
Aside from the above-mentioned indicators, the PSA also releases other poverty-related statistics such as income gap, poverty gap and severity of poverty. The income gap measures the average income required by the poor in order to get out of poverty, expressed relative to the poverty threshold. The poverty gap refers to the income shortfall (expressed in proportion to the poverty threshold) of families with income below the poverty threshold, divided by the total number of families. The severity of poverty is the total of the squared income shortfall (expressed in proportion to the poverty threshold) of families with income below the poverty threshold, divided by the total number of families.
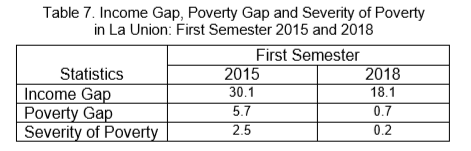
In the first semester of 2018, on the average, incomes of poor families in La Union were short by 18.1 percent of the poverty threshold. This can also be translated to a total cash of Php1,639,on average, in a month for a family of five to move everyone out of poverty in La Union in 2018. The income gap, poverty gap and squared poverty gap significantly improved from 1st semester of 2015 to the same period in 2018.
Provinces nationwide were clustered using confidence intervals of poverty incidence as the clustering variable, where cluster 1 is comprised of poorest cluster of provinces and cluster 5 being the least poor. In 2018, La Union together with the other provinces of Region I joined the rooster of least poor provinces (cluster 5) consisting of 18 provinces nationwide from its former group in 2015 of cluster 4.

Food threshold - the minimum income required for a family/individual to meet the basic food needs, which satisfies the nutritional requirements for economically necessary and socially desirable physical activities.
Note: Food threshold are estimated using actual prices collected by PSA for the estimation of the Consumer Price Index (CPI). In consonance with the updating of the market basket for the collection of prices for CPI, First Semester 2015 Poverty Statistics were revised accordingly.
Income Gap - the average income shortfall, expressed in proportion to the poverty threshold of families/individuals with income below the poverty threshold.
Note: The difference between the income gap and the poverty gap is the use of number of poor families/individuals as denominator for the income gap. For the poverty gap, the total number of families/individuals is used.
Poverty gap- the total income shortfall (expressed in proportion to the poverty threshold) of families/individuals with income below the poverty threshold, divided by the total number of families/individuals.
Poverty incidence - the proportion of families/individuals with per capita income less than the per capita poverty threshold to the total number of families/individuals.
Poverty threshold - the minimum income required for a family/individual to meet the basic food and non-food requirements.
Notes: Basic food requirements are currently based on 100% adequacy for the Recommended Energy and Nutrient Intake(RENI) for protein and energy equivalent to an average of 2000kilocalories per capita,and 80% adequacy for other nutrients. On the other hand, basic non-food requirements, indirectly estimated by obtaining the ratio of food to total basic expenditures from a reference group of families, cover expenditure on: 1) clothing and footwear; 2) housing; 3) fuel, light, water; 4) maintenance and minor repairs; 5) rental value of occupied dwelling units; 6) medical care; 7) education; 8) transportation and communication; 9) non-durable furnishings; 10) household operations: and 11) personal care & effects.
Severity of poverty - the total of the squared income shortfall (expressed in proportion to the poverty threshold) of families/individuals with income below the poverty threshold, divided by the total number of families/individuals.
Note: This is equal to the Foster-Greer-Thorbecke (FGT) family of measures with alpha = 2. It is a poverty measure, which is sensitive to the income distribution among the poor- the worse this distribution is, the more severe poverty is.
Subsistence incidence - the proportion of families/individuals with per capita income less than the per capita food threshold to the total number of families/individuals.
NIÑO E. TUAZON
(Supervising Statistical Specialist)
Officer-in-Charge
| Attachment | Size |
|---|---|
|
|
112.05 KB |