

Release Date :
Reference Number :
Issue No. 2 Series of 2017
In 2016, the livestock and poultry sector in Region I recorded a 0.79 percent drop in production. The decline in production was apparent on both the first and second semesters by 0.48 percent and 1.11 percent, respectively. This was largely contributed by the decline in the poultry subsector by 4.37 percent while the livestock subsector had an output gain of 1.93 percent.
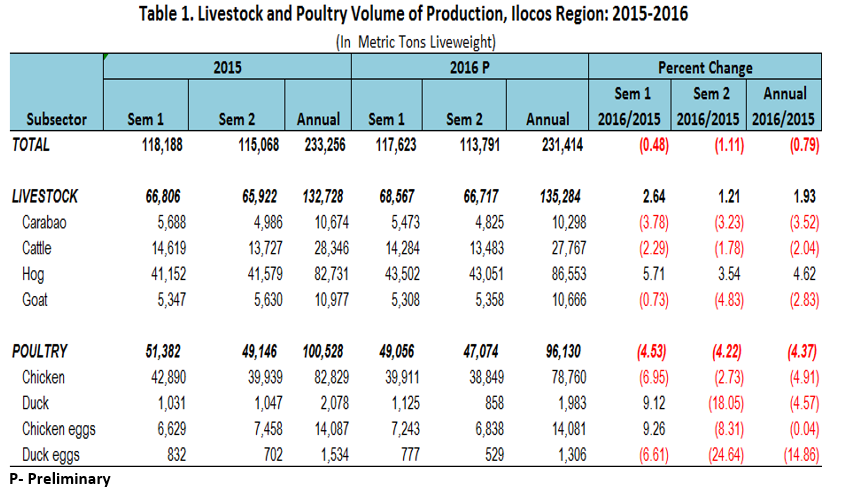
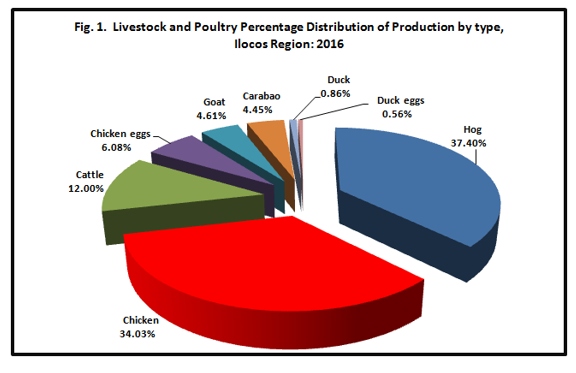
The major contributors to the total livestock and poultry production were swine and chicken with shares of 37.40 percent and 34.03 percent, respectively. Cattle followed with a share of 12.00 percent, chicken eggs with 6.08 percent, goat with 4.61 percent, carabao by 4.45 percent, duck and duck eggs with shares of 0.86 percent and 0.56 percent, respectively.
Livestock Sector
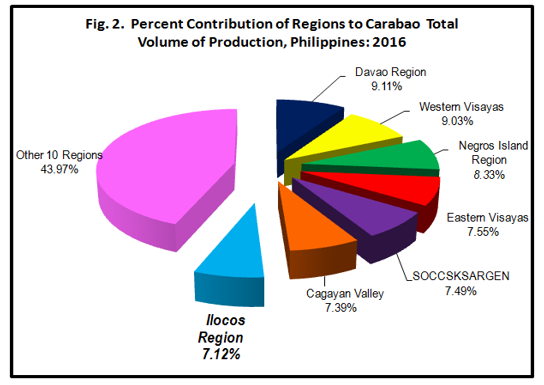
Carabao production in the region was 10,298 metric tons liveweight. This was lower by 3.52 percent as compared to last year’s level. Region I contributed 7.12 percent to the national production of 144,685 metric tons and ranked 7th among the top carabao producing regions.
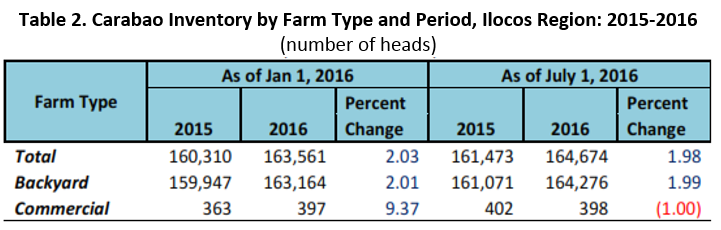
Total inventory of carabao in Region I as of January 1, 2016 was 163,561 heads. This was 2.03 percent higher than last year’s headcount. Most of the stocks were reserved for breeding and other purposes. Likewise, total inventory as of July 1, 2016 was higher by 1.98 percent over last year’s headcount of 161,473. Backyard farms accounted 99.76 percent of the total carabao population while the remaining 0.24 percent were in commercial farms.
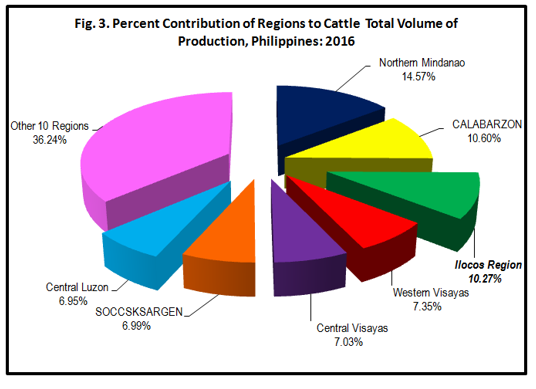
Production of cattle in Region I was estimated at 27,767 metric tons liveweight or 2.04 percent lower than last year’s level. Region I ranked 3rd in the country’s cattle production of 270,415 metric tons with a share of 10.27 percent
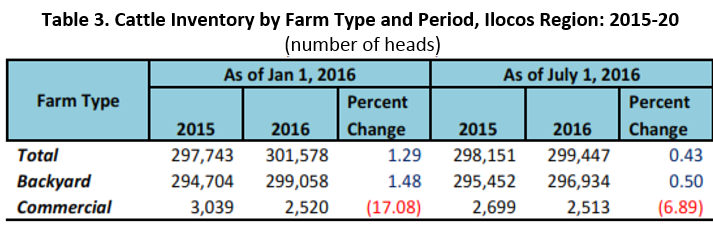
The region’s total inventory of cattle as of January 1, 2016 was 301,578 heads. This was higher by 1.29 percent as compared to same period last year. This was contributed by increased inventory in backyard farms as more were kept as breeders. However, a headcount decline of 17.08 percent was noted in commercial farms.
As of July 1, 2016, total cattle inventory was 299,447 heads or 0.43 percent higher than last year. About 99.16 percent of the total inventory were in the backyard, while the remaining 0.84 percent were in the commercial farms.
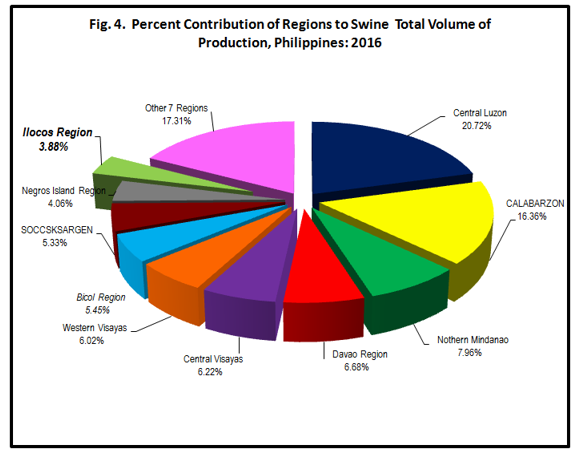
Swine production in Region 1 gained by 4.62 percent this 2016 over last year’s level of 82,731 metric tons. The total swine production in the country is 2,231,660metric tons liveweight. Region 1 was among the top 10 producers of swine at 7th place with a share of 3.88 percent.
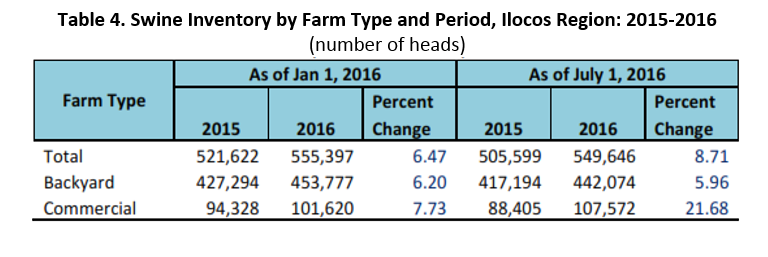
Total inventory of swine as of January 1, 2016 was 555,397 heads, higher by 6.47 percent than last year. Likewise, as of July 1, 2016 total inventory increased by 8.71 percent. The number of swine on both backyard and commercial farms grew by 5.96 percent and 21.68 percent, respectively.
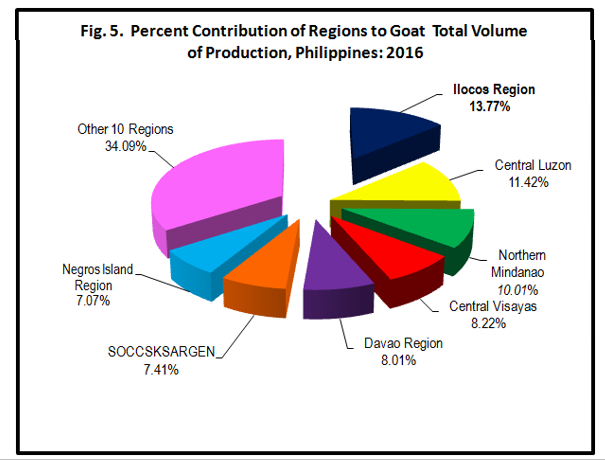
Goat production in the region was estimated at 10,666 metric tons equivalent to a drop of 2.83 percent as compared to last year. Despite the decline in production, Region 1, remained as the number one producer of goat in the country with a share of 13.77 percent to the national production of 77,454 metric tons.
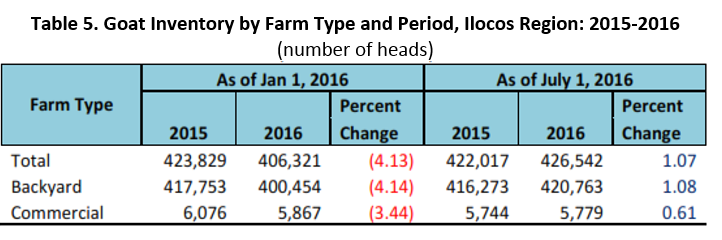
Total population of goat in the region as of January 1, 2016 was 406,321 heads. This was lower by 4.13 percent over last year’s headcount. However, inventory of goat as of July 1, 2016 increased by 1.07 percent as lesser were disposed and additional stocks were not yet of marketable size. About 98.65 percent of the total goat inventory were in backyard farms while the remaining 1.35 percent were in the commercial farms.
Poultry Sector
Production of chicken in the region had a contraction of 4.91 percent from 82,829 metric tons last 2015 to 78,760 metric tons in 2016. The drop was attributed to Newcastle Disease (NCD) that affected the region during the 1st semester. This avian disease spread throughout the region and caused high mortality on native and free range chickens.
Region 1 was among the top five producers of chicken in the country with a share of 4.70 percent.

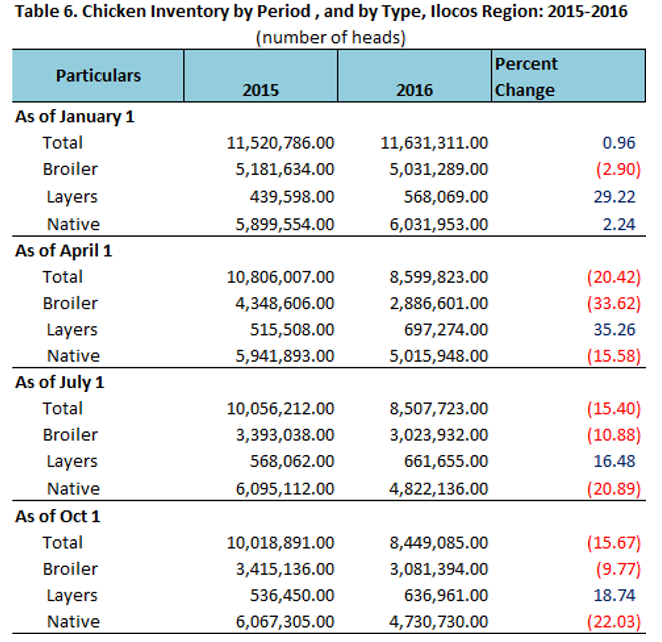
Table 6 showed a decline in total inventory of chicken as of April 1, 2016, July 1, 2016 and October 1, 2016. From the beginning inventory of 11.6 million heads as of January 1, 2016, the number of headcounts dropped to 8.6 million heads as of April 1, 2016. The inventory as of April 1, 2016 was 20.42 percent lower than last year of same date.
The population of broiler and native chickens as of April 1, 2016 dropped by 33.62 percent and 15.58 percent respectively as compared to same date last 2015. This decline continued in the succeeding periods as of July 1, 2016 and October 1, 2016. On the other hand, inventory of layers as of April 1, 2016 increased by 35.26 percent as compared to last year’s level and this can be attributed to additional tunnel vent layer farms.
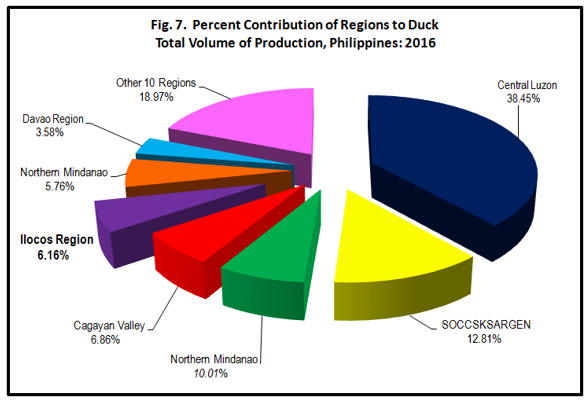
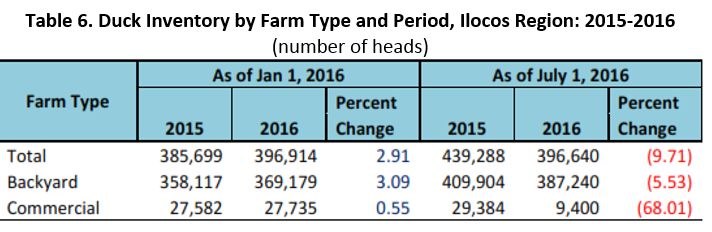
The region’s duck production in 2016 was 1,983 metric tons. This declined by 4.57 percent as compared to same period last year. Region 1 ranked 5th in the country’s total duck output of 32,216 metric tons with a contribution of 6.16 percent.
Total inventory of duck as of January 1, 2016 was 396,914 heads. This increased by 2.91 percent as compared to same period last year. The number of headcounts on both backyard and commercial farms increased by 3.09 percent and 0.55 percent, respectively. It was noted however, that as of July 1, 2016, the total inventory of duck dropped to 9.71 percent compared to last year’s level. About 97.63 percent of the total duck inventory during the period were in the backyard farms, while the remaining 2.27 percent were in the commercial farms.
TECHNICAL NOTES
• Newcastle Disease. Newcastle Disease is one of the most serious of all avian diseases. It is caused by a virus (paramyxovirus, of the Group 1 serotype). The incubation period (time from exposure to the development of signs of disease) is 4 to 7 days. In general, signs can include ocular and/or nasal discharge, dyspnea, and bloody diarrhea. Central nervous system signs can also occur, including depression or the opposite-hyperexcitability; vestibular or balance problems; tremors, especially of the head and neck; weakness; and partial or total paralysis. The onset of signs may be semi-acute to sudden death. Signs vary depending on the strain of virus and the species of bird. (www.peteducation.com)
• Production. Refers to the volume of indigenous (locally-raised) animals disposed for slaughter which include animals exported or shipped-out for slaughter (in “head” and in “liveweight equivalent”).
• Livestock – farm animals kept or raised for consumption, work or leisure. In general, poultry is separated as a distinct group of farm animals. For purposes of census and surveys, livestock covers only those that are tended and raised by an operator.
• Poultry - a collective term for all domesticated avian for the purpose of food consumption or, the carcass of such avian dressed/processed for human consumption.
• Animal Inventory (also, Animal Population) – the number of domesticated animals in head present in the farm at specific reference date.
• Backyard Farm/Raiser- refers to any farm or household raising at least one head of animal or bird and does not qualify as a commercial farm.
• Commercial Livestock Farm/Operator - refers to any livestock operator or farm which operation satisfies at least one of the following conditions: a) at least 21 head of adults and zero young b) at least 41 head of young animals c) at least 10 head of adults and 22 head of young animals.
• Commercial Poultry Farm/Operator- refers to any poultry operator or farm which operation satisfies at least one of the following conditions: a) 500 layers or 1,000 broilers b) 100 layers and 100 broilers if raised in combination c) 100 head of duck regardless of age.
| Attachment | Size |
|---|---|
|
|
282.38 KB |