

Release Date :
Reference Number :
Issue No. 18, Series of 2016

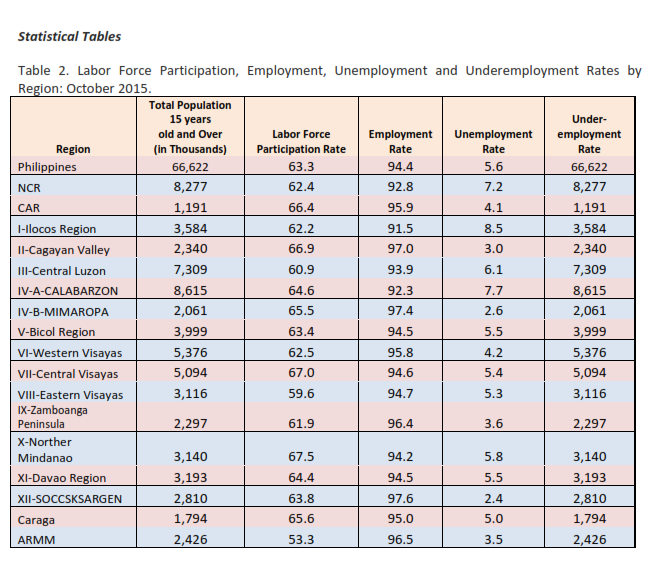
The results of the October 2015 Labor Force Survey (LFS) revealed an employment rate of 91.5 percent for Ilocos Region. This was 1.0 percentage point lower than the 92.5 percent employment rate recorded in October 2014. The employment rate of the region was the lowest among the seventeen regions and far beyond the 94.4 percent employment rate of the Philippines. In terms of the labor force participation rate (LFPR) in Ilocos Region posted an increase of 0.2 percentage point from 62.0 percent in October 2014 to 62.2 percent in October 2015. This was lower than the country’s LFPR of 63.3 percent in October 2015.
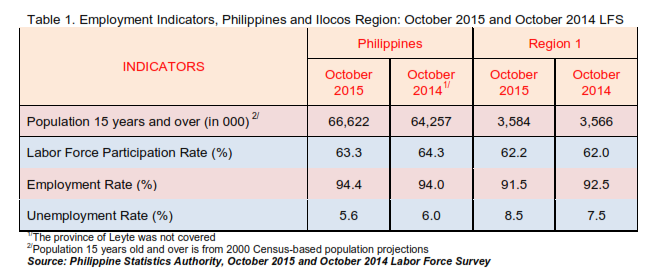
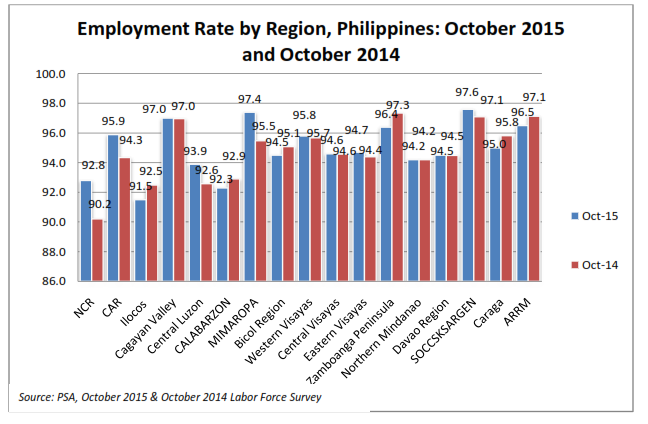
Among the regions, Ilocos Region (Region I) recorded the lowest employment rate of 91.5 percent in October 2015. On the other hand, SOCCSKSARGEN (Region XII) had the highest employment rate of 97.6 percent. Meanwhile, the employment rates of Ilocos Region and NCR were the lowest employment rates among the seventeen regions for the period October 2015 and October 2014 respectively.
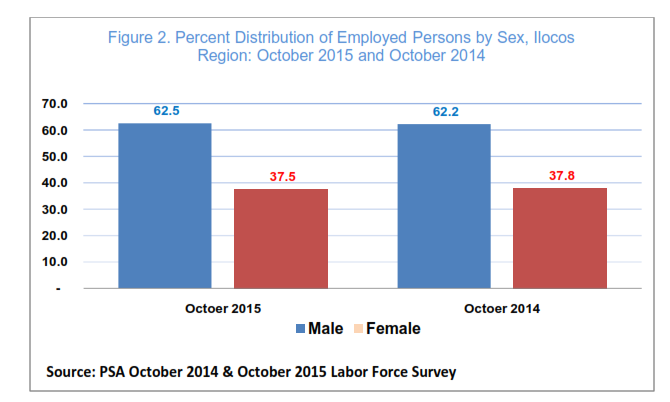
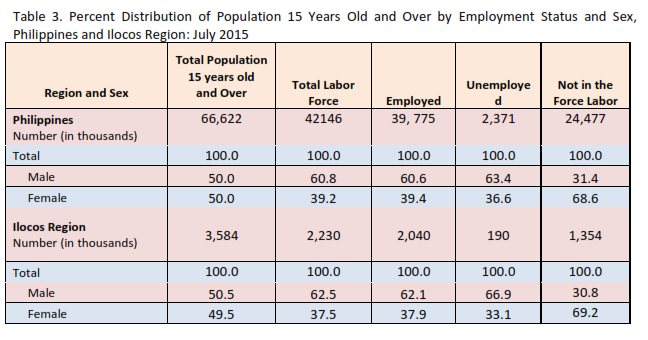
There was an increase of 0.3 percentage point in the percentage of employed males in Ilocos Region from 62.2 percent in October 2014 to 62.5 percent in October 2015. On the other hand, a decrease of 0.3 percentage point was recorded among the employed females, from 37.8 percent in October 2014 to 37.5 percent in October 2015.
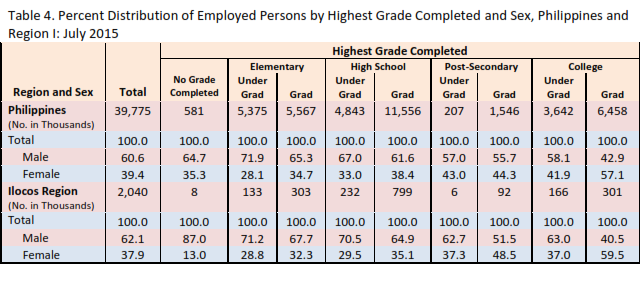
By education, 50.6 percent of the employed persons in the Ilocos Region attained high school, which was higher by 9.4 percentage points than the 41.2 percent recorded for the whole country.
About 22.9 percent of the employed persons in Ilocos Region reached college level, which was lower by 2.5 percentage points from the Philippines figure of 25.4 percent in October 2015.
On the other hand, about 4.8 percent of the employed persons in Ilocos Region attained post-secondary level, which was 0.4 percentage point higher than the 4.4 percent recorded for the whole country.
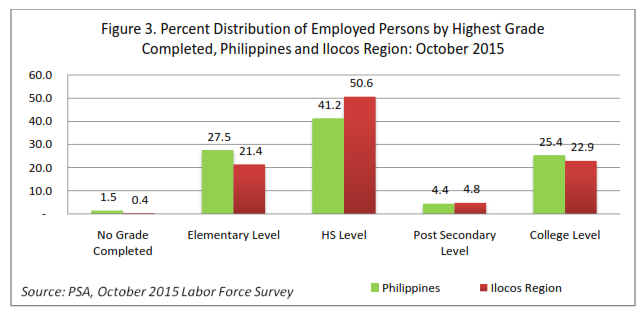
About 21.4 percent of the employed persons in Ilocos Region attained elementary level, lower by 6.1 percentage points with that of the Philippines, which was posted at 27.5 percent.
The percentage of employed persons in Ilocos Region with no grade completed was only 0.4 percent, lower by 1.1 percentage points as compared to the 1.5 percent recorded for the Philippines.
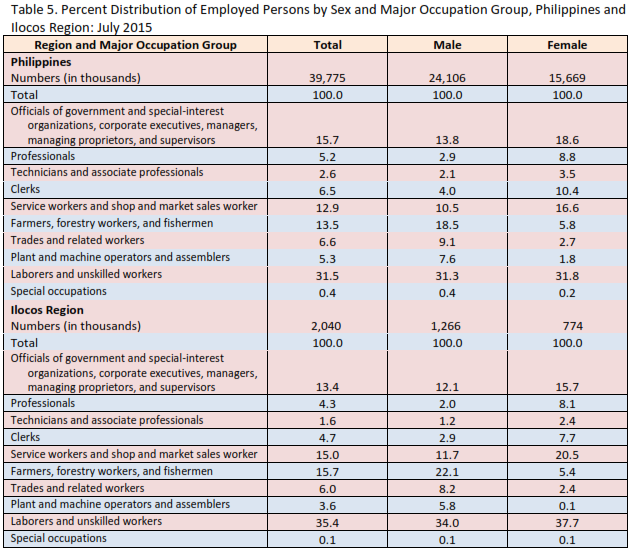
Among the various occupation groups, the laborers and unskilled workers comprised the biggest group making up more than one-third of the total employed persons in October 2015 and October 2014, at 35.3 percent and 38.7 percent, respectively.
Farmers and fishermen made up the second largest occupation group in Ilocos Region accounting for 15.7 percent in October 2015 and 15.4 in October 2014.
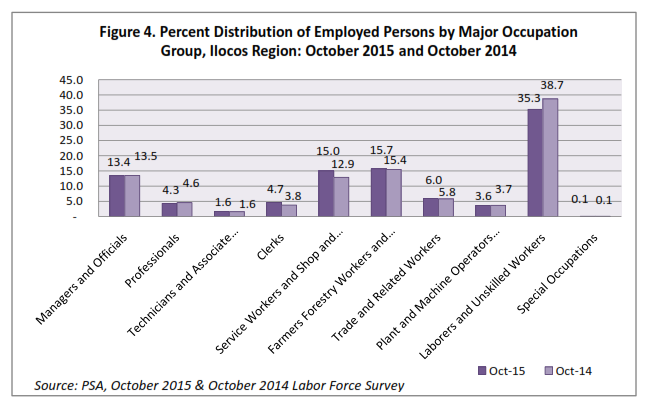
Service workers, shop and market sales workers was the third biggest group with 15.0 percent in October 2015. Meanwhile, the officials of the government and special interest organizations, corporate executives, managers, managing proprietors and supervisors was the third group in October 2014 with 13.5 percent.
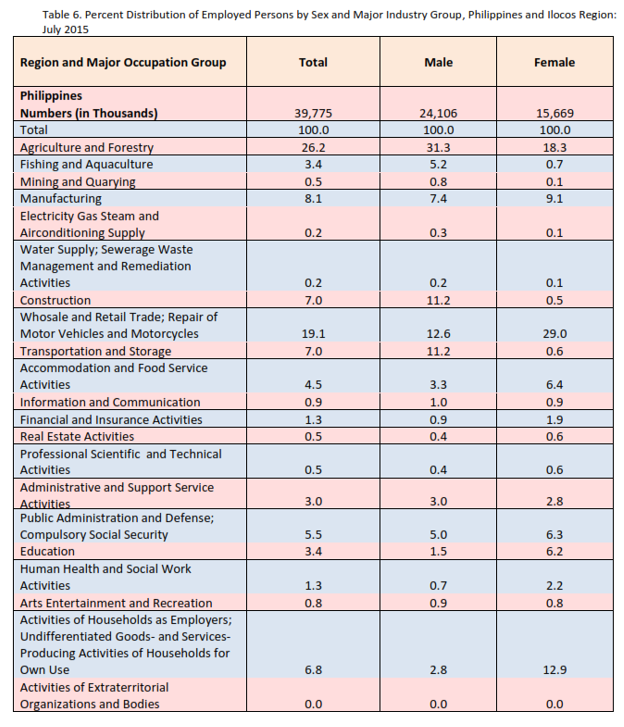
In terms of the percent distribution of employed persons by major industry, workers in the services sector accounted the largest group of workers, making up 54.1 percent and 51.8 percent of the total employed in Ilocos Region in October 2015 and October 2014, respectively.
Workers in the agriculture sector, on the other hand, comprised the second largest group in Ilocos Region, accounting for 32.5 percent and 35.3 percent in October 2015 and October 2014, respectively.
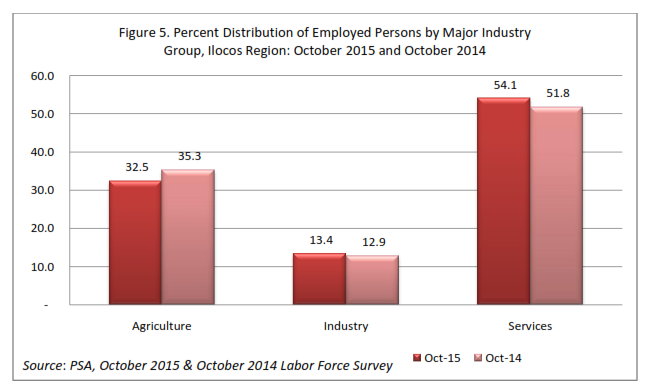
Meanwhile, workers in the industry sector made up 13.4 percent of the total number of employed persons in Ilocos Region in October 2015, and 12.9 percent in October 2014.
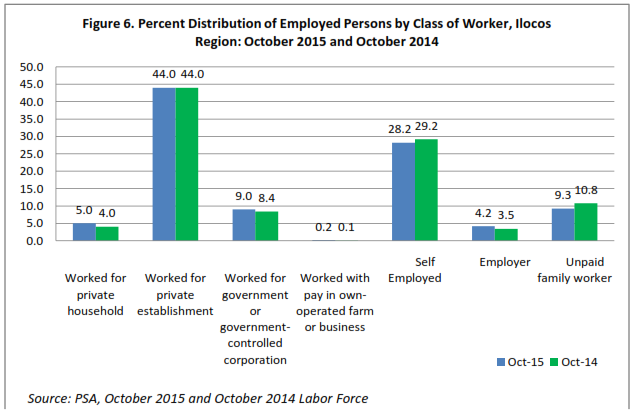
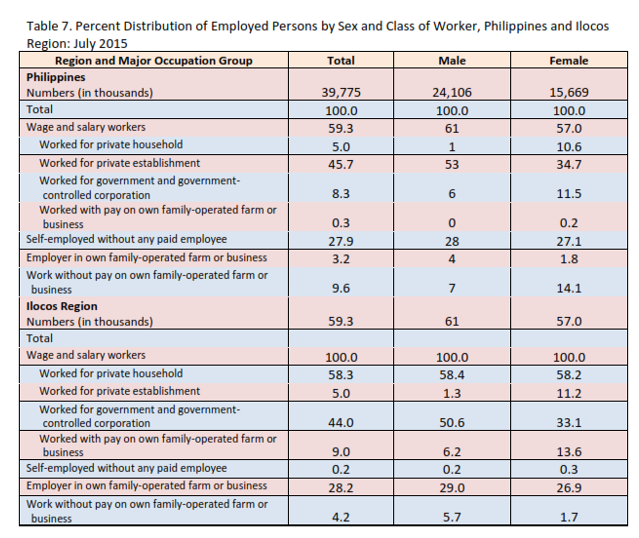
Almost half (44.0%) of the employed persons in Ilocos Region worked for private establishments in October 2015. This was the same figure obtained in October 2014. Self-employed individuals ranked second in October 2015 with 28.2 percent of the total employed persons in Ilocos Region. This was lower by 1.0 percentage point as compared to October 2014 with 29.2 percent. The third biggest class of workers in October 2015 were those unpaid family worker with 9.3 in October 2015 but lower by 1.1 percent as compared in October 2014 with 10.4 percent. This was followed closely by employed in government with a share of 9.0 percent and 8.4 percent in October 2015 and October 2014 respectively. On the other hand, the proportion of individuals who worked for private households in October 2015 was 5.0 percent as compared to 4.0 percent in October 2014. A promising 4.2 and 3.5 percent for October 2015 and October 2014 respectively was recorded for persons who were employer of their own businesses.
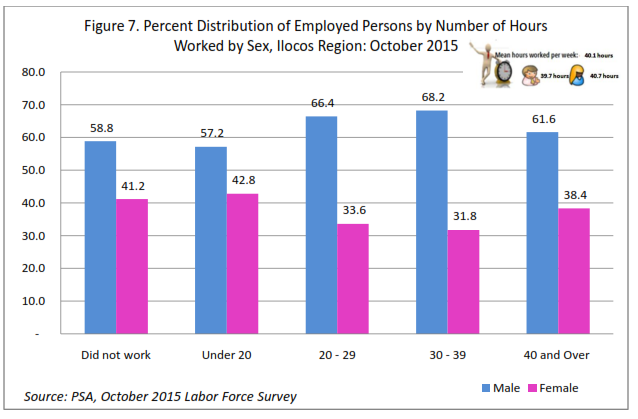
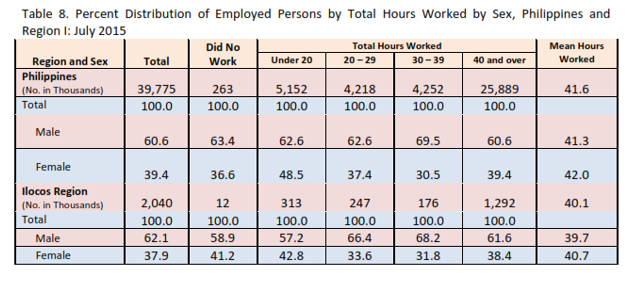
The average number of hours worked per week of employed persons in Ilocos Region was 40.1 hours. Male workers tend to have shorter average number of working hours per week (39.7 hours) than their female counterparts (40.7 hours). It can also be noted that larger proportion of employed males worked 20 hours or more per week. On the other hand, majority of the employed individuals who did not work during the reference period were males (58.8 percent) as compared to females (41.2 percent).
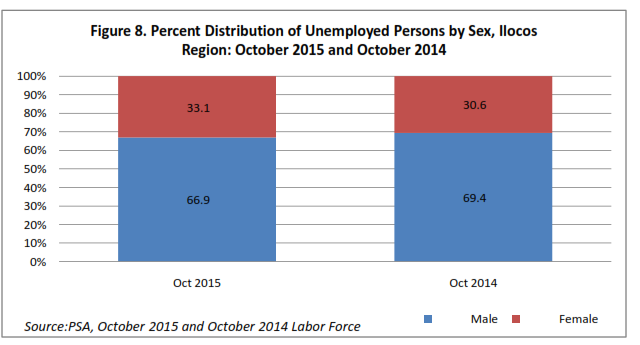
In October 2015, 66.9 percent of the unemployed persons in Ilocos Region were males and 33.1 percent were females. Compared to the figure in October 2014, the proportion of unemployed females decreased by 2.5 percentage points.
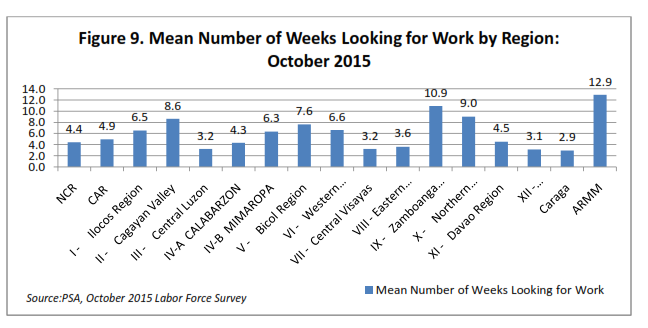
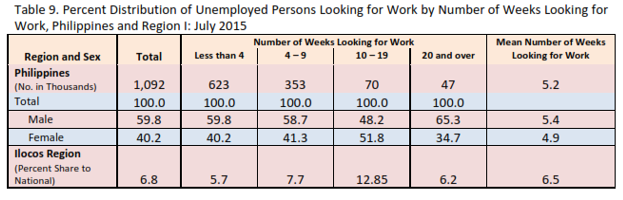
In terms of job hunting, unemployed persons in Ilocos Region looked for work for more than a month (6.5 weeks) on the average before landed a job or stopped looking for a job. The shortest duration for job hunting was recorded by Caraga Region with an average of 2.9 weeks, while the longest duration was reported in Autonomous Region in Muslim Mindanao (ARMM) with 12.9 weeks on the average.
TECHNICAL NOTES
-
·Starting July 2003, the Labor Force Survey (LFS) adopted the 2003 Master Sample Design, with a sample size of approximately 50,000 households.
-
·Starting in the January 2012 LFS, the codes for industry adopted the 2009 Philippine Standard Industrial Classification (PSIC). Prior to this, codes for industry used the 1994 PSIC.
-
·Starting in the January 2012 LFS, more detailed categories for highest grade completed used in the 2010 Census of Population and Housing (CPH) were also adopted.
-
Starting in the January 2012 LFS, a question on whether a household member is a graduate of a technical vocational course was asked for each person 15 years or older.
-
Starting April 2005, the new unemployment definition was adopted per NSCB
-
Resolution Number 15 dated October 20, 2004. As indicated in the said resolution, the unemployed include all persons who are 15 years and over as of their last birthday and are reported as: (1) without work and currently available for work and seeking work; or (2) without work and currently available for work but not seeking work for the following reasons:
1. Tired/believed no work available
2. Awaiting results of previous job application
3. Temporary illness/disability
4. Bad weather
5. Waiting for rehire/job recall
-
·Starting with the January 2007 LFS round, the population projections based on the 2000 Census of Population and Housing was adopted to generate the labor force statistics. This is in compliance with NSCB Resolution No. 1 series of 2005 entitled “Adoption of the Methodology Used in Generating the 2000 Census of Population and Housing-Based National Population Projections”
| Attachment | Size |
|---|---|
|
|
1.3 MB |