

Release Date :
Reference Number :
2024-68
Reference Period
July 2024
1. Headline Inflation
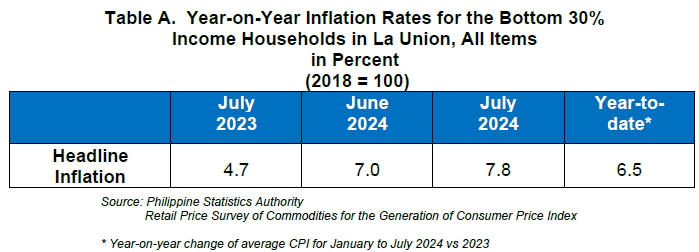
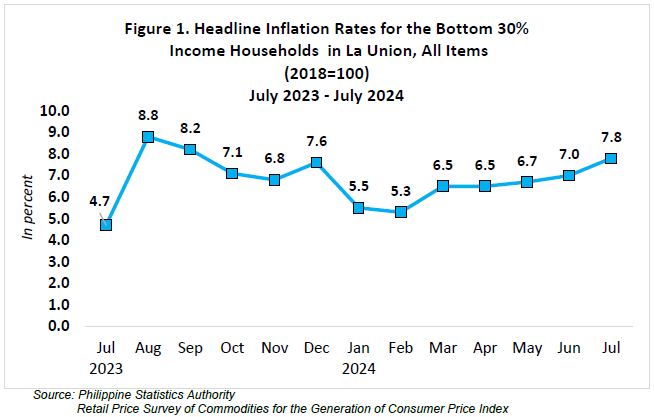
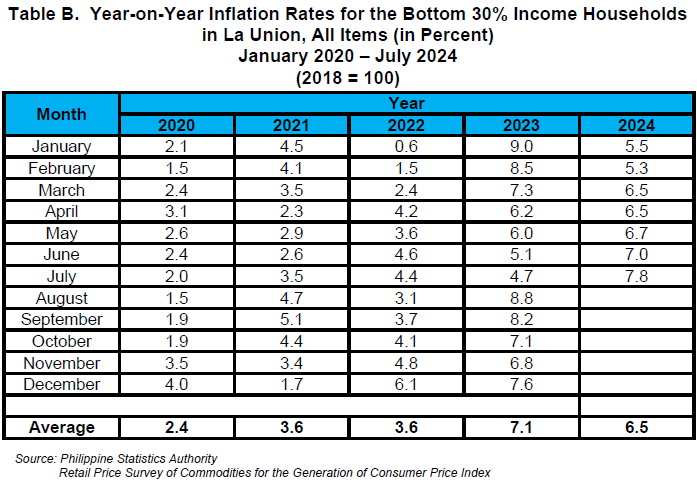
La Union’s headline inflation for the bottom 30% income households increased to 7.8 percent in July 2024 from 7.0 percent in June 2024. This brings the provincial average inflation for this income group from January to July 2024 to 6.5 percent. In July 2023, inflation rate for the bottom 30% income households was posted at 4.7 percent. (Table A and Figure1)
1.1 Main Drivers to the Upward Trend of the Overall Inflation
The main driver to the upward trend of the overall inflation for the bottom 30% income households in the province in July 2024 was the heavily weighted food and non-alcoholic beverages with 12.7 percent annual inflation during the month from 11.7 percent in June 2024.
This was followed by transport with an annual increment of 5.4 percent in Juy 2024 from 3.9 percent in June 2024. Housing, water, electricity, gas and other fuels ranked third main contributor to the acceleration of inflation for this income group as it recorded a year-on-year increase of 5.3 percent during the month from 4.7 percent inflation in the previous month.
In addition, education services also recorded a faster annual increment during the month with 1.6 percent inflation from zero inflation in the previous year.
Meanwhile, the indices of the following commodity groups retained their respective previous month’s annual increment:
Alcoholic beverages and tobacco, at 3.4 percent;
Clothing and footwear, at 1.5 percent;
Health, at 1.5 percent;
Furnishings, household equipment and routine household maintenance, at 0.8 percent;
Information and communication, 0.2 percent;
Recreation, sport and culture, at 0.3 percent;
Personal care and miscellaneous goods and services, at 0.7 percent.
Restaurants and accommodation services, and financial services recorded zero percent inflation during the month.
1.2 Main Contributors to the Overall Inflation
The top three commodity groups contributing to the July 2024 overall inflation for the bottom 30% income households of the province were the following:
Food and non-alcoholic beverages with 82.4 percent share or 6.4 percentage points;
Housing, water, electricity, gas and other fuels with 10.7 percent share or 0.8 percentage point; and
Transport with 4.5 percent share or 0.4 percentage point.
2. Food Inflation
Food inflation for the bottom 30% income households at the provincial level also exhibited an uptrend with 13.4 percent in July 2024 from 12.3 percent in June 2024. In July 2023, food inflation was observed at 4.7 percent.
2.1 Main Drivers to the Upward Trend of Food Inflation
The uptrend in the food inflation of the province in July 2024 was primarily contributed by the faster annual increase in the rice with an annual growth rate of 36.4 percent in July 2024 from 34.8 percent in June 2024. This was followed by meat and other parts of slaughtered land animals at 5.8 percent during the month from 4.1 percent in June 2024. The third contributor to the uptrend of food inflation in July 2024 was recorded in the vegetables, tubers, plantains, cooking bananas and pulses with a faster year-on-year mark-up of 9.6 percent during the month from 1.6 percent in June 2024.
In addition, the commodity groups with a faster annual increment during the month compared to their previous month’s, was recorded in the following commodity groups:
Ready-made food and other food products not elsewhere classified, at 8.0 percent from 7.3 percent;
Flour, bread and other bakery products, pasta products, and other cereals, at 2.5 percent from 2.4 percent; and
Milk, other dairy products and eggs, at 0.1 percent inflation from -3.5 percent.
In contrast, slower annual increases were observed in the indices of fruits and nuts at 12.5 percent in July 2024 from 25.2 percent in June 2024 and fish and other seafoods at 2.5 percent during the month from 4.7 percent in June 2024.
A slower annual decline of 4.3 percent in July 2024 from an annual drop of 4.5 percent in June 2024 was observed in the food group of sugar, confectionery and desserts.
Meanwhile, the annual increase of 17.9 percent in the corn index and the annual decline of 6.6 percent in the oils and fats index remained during the month.
2.2 Main Contributors to the Food Inflation
Food inflation contributed 81.9 percent or 6.4 percentage points to the overall inflation for the bottom 30% income households in the province in July 2024.
Among the food groups, the top three main contributors to the food inflation during the month were the following:
Cereals and cereal products, which includes rice, corn, flour, bread and other bakery products, pasta products, and other cereals with 83.8 percent share or 11.2 percentage points;
Meat and other parts of slaughtered land animals with 6.5 percent share or 0.9 percentage point; and
Vegetables, tubers, plantains, cooking bananas and pulses with 4.6 percent share or 0.6 percentage point.
SGD. DANITES E. TEÑIDO, PhD
Chief Statistical Specialist
La Union Provincial Statistical Office
/MMAAA
| Attachment | Size |
|---|---|
|
|
307.54 KB |