

Release Date :
Reference Number :
2024-024
Reference Period
2024
Ilocos Region
I. Overall Inflation
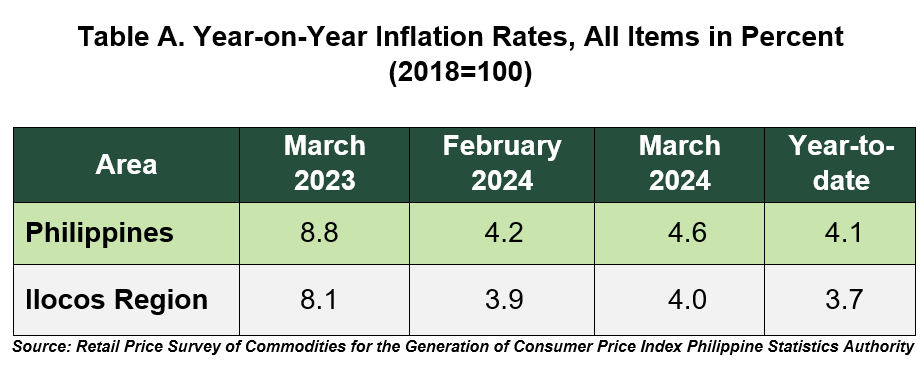
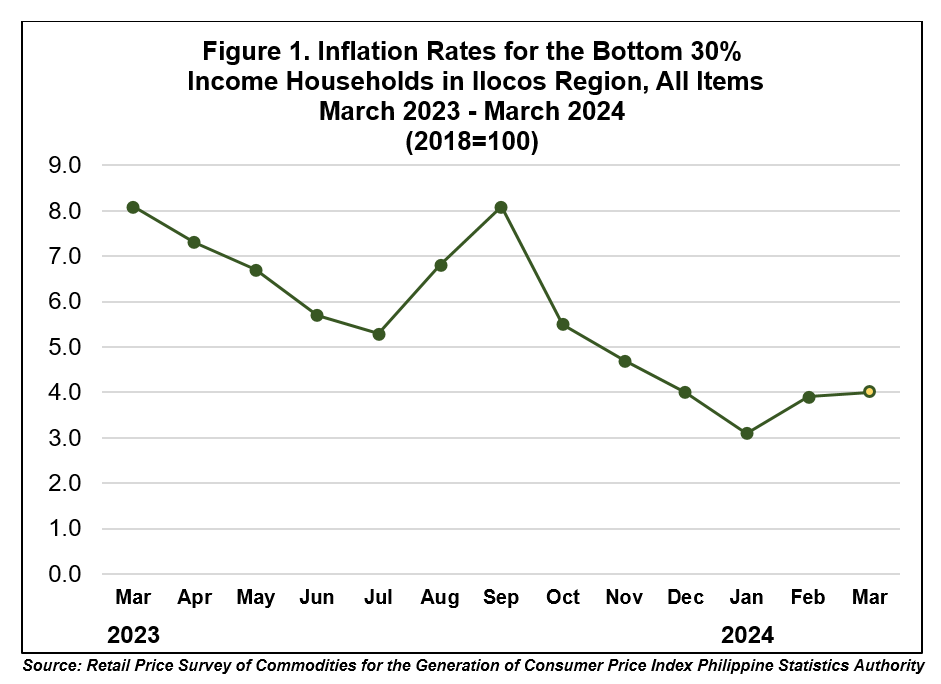
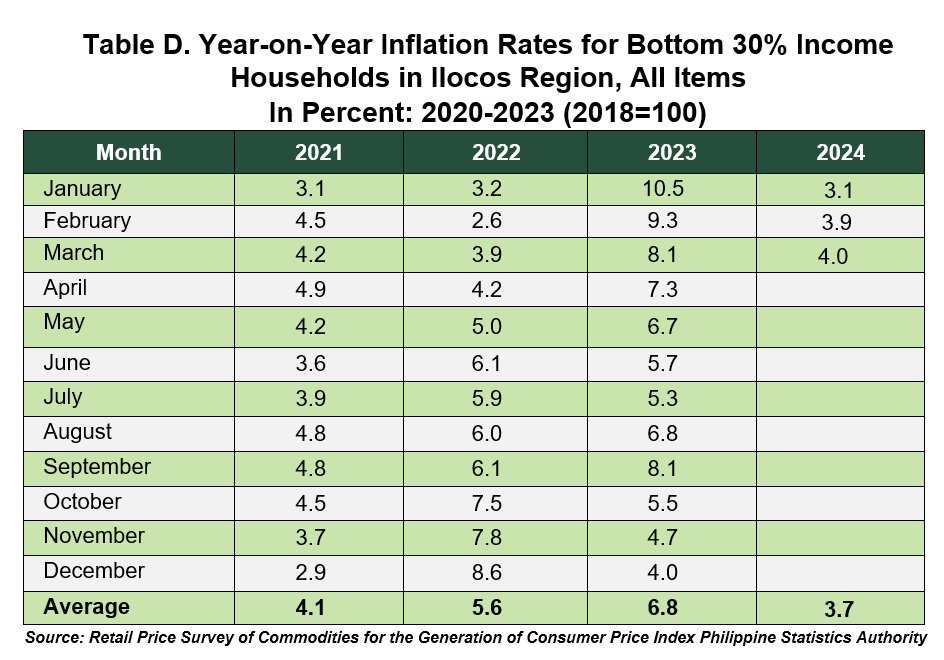
The inflation rate of the Ilocos Region for the Bottom 30% increased from 3.9 percent in February 2024 to 4.0 percent in March 2024, higher by 0.1 percentage point. On the other hand, it is lower
by 4.1 percentage points from the rate of 8.1 percent in March 2023.
1.1 Main Drivers to the Upward Trend of the Overall Inflation
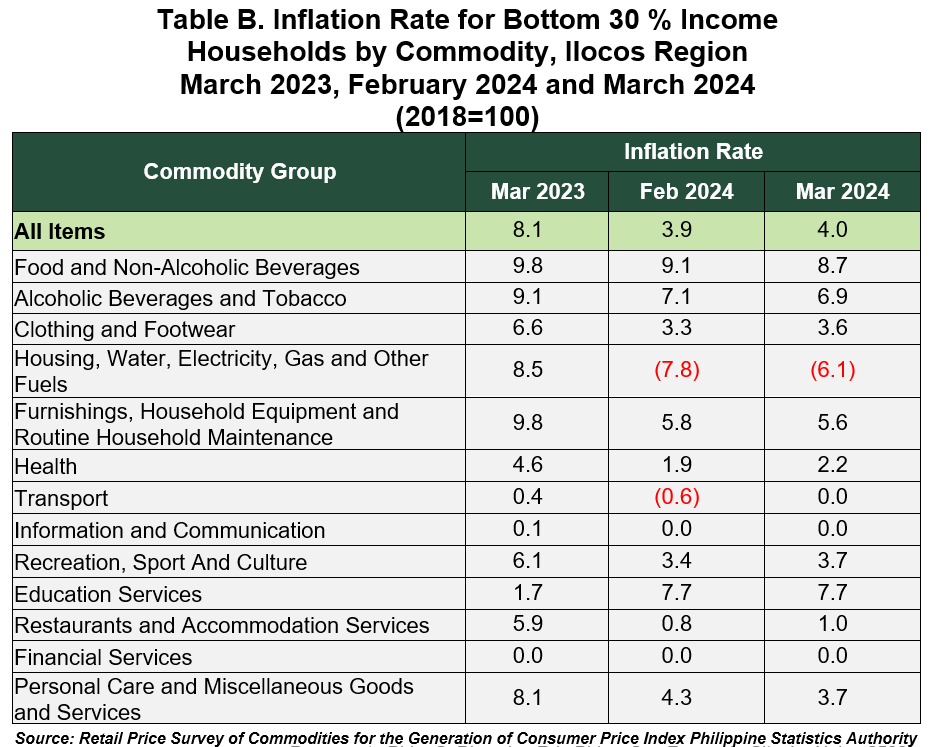
The uptrend of the overall inflation in March 2024 was primarily brought about by the higher year-on-year growth in the housing, water, electricity, gas and other fuels at -6.1 percent in March 2024 from the -7.8 percent in the previous month.
In addition, higher annual rates were also noted in the indices of the following commodity groups during this month:
a. Clothing And Footwear, 3.6 percent from 3.3 percent;
b. Health, 2.2 percent from 1.9 percent;
c. Transport, 0.0 percent from -0.6 percent;
d. Recreation, Sport and Culture, 3.7 Percent from 3.4 percent; and
e. Restaurants and Accommodation Services, 1.0 percent from 0.8 percent.
On the other hand, decreased indices were observed in the following commodity groups:
a. Food and Non-Alcoholic Beverages with 8.7 percent from 9.1 percent;
b. Alcoholic Beverages and Tobacco with 6.9 percent from 7.1 percent;
c. Furnishings, Household Equipment and Routine Household Maintenance with 5.6 percent from 5.8 percent; and
d. Personal Care, and Miscellaneous Goods and Services with 3.7 percent from 4.3 percent.
The rest of the commodity groups retained their previous month’s inflation rates or had zero percent annual growths. (Table B)
1.2 Main Contributor to the Overall Inflation
The following commodity groups were the top three contributors to the March 2024 overall inflation for the bottom 30% income households:
a. Food and Non-Alcoholic Beverages, 104.3 percent share or 4.17 percentage points;
b. Personal Care, and Miscellaneous Goods and Services, 5.1 percent share or 0.21 percentage point; and
c. Alcoholic Beverages and Tobacco, 4.0 percent share or 0.16 percentage point.
II. Food Inflation
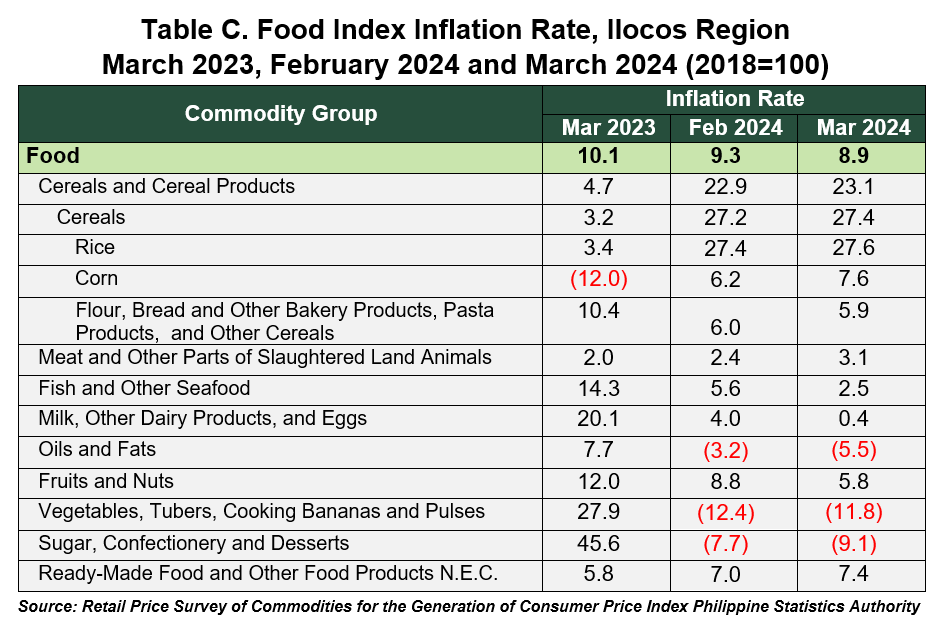
Food inflation for the bottom 30% income households at the regional level moved at a slower pace of 8.9 percent in March 2024 from 9.3 percent in the previous month. In March 2023, its annual increase was observed at 10.1 percent.
2.1 Main Drivers to the Upward trend in Food Inflation
The deceleration of food inflation was mainly due to the lower year-on-year growth rates of Fish and other seafood (ND) at 2.5 percent in March 2024 from 5.6 percent in February 2024. Milk, other dairy products and eggs (ND) also contributed to the downtrend. It posted a faster year-on-year decrease from 4.0 percent to 0.4 percent. Likewise, Fruits and nuts (ND) decreased from 8.8 percent to 5.8 percent.
In addition, lower annual growth decreases in Flour, Bread and Other Bakery Products, Pasta Products, and Other Cereals, 5.9 percent from 6.0 percent; Oils and fats (ND), -5.5 percent from -3.2 percent; and Sugar, confectionery and desserts (ND), -9.1 percent from -7.7 percent.
On the other hand, higher annual growth rates were observed in the following food groups during the month of February 2024:
a. Rice, 27.6 percent from 27.4 percent;
b. Corn, 7.6 percent from 6.2 percent;
c. Meat and other parts of slaughtered land animals (ND), 3.1 percent from 2.4 percent;
d. Vegetables, tubers, plantains, cooking bananas and pulses (ND), -11.8 percent from -12.4 percent; and
e. Ready-made food and other food products n.e.c. (ND), 7.4 percent from 7.0 percent. (Table C)
2.2 Main Contributors to the Food Inflation
Food inflation contributed 99.9 percent or 4.00 percentage points to the March 2024 overall inflation for this particular income group.
Among the food groups, the top three main contributors to the food inflation during the month were the following:
a. Cereals and cereal products (ND), 99.0 percent or 8.81 percentage points;
b. Meat and other parts of slaughtered land animals (ND), 4.7 percent or 0.42 percentage points; and
c. Fish and other seafood (ND), 3.4 percent or 0.31 percentage points.
Provinces
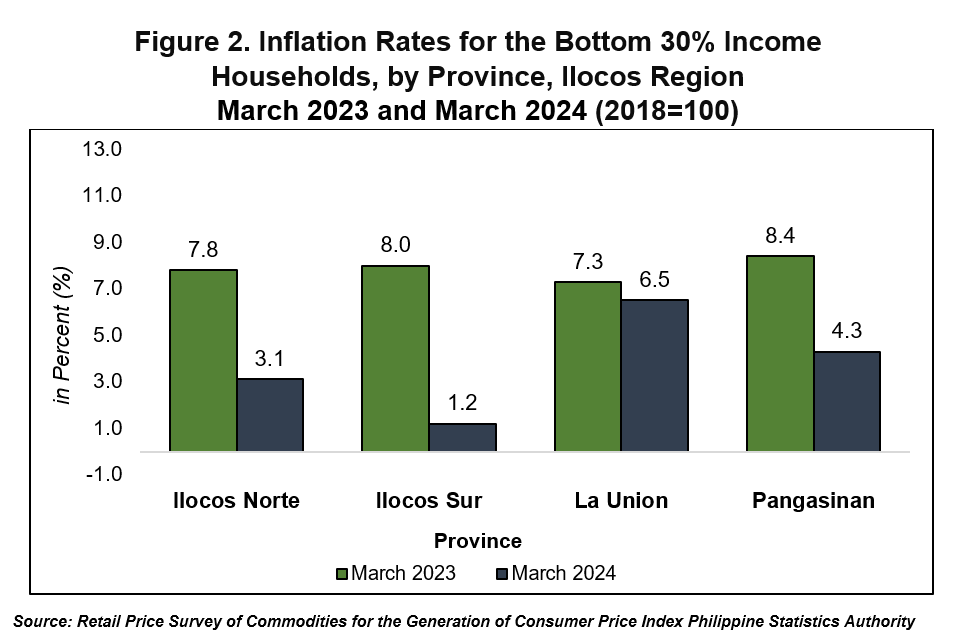
Among the provinces, La Union posted the highest inflation rate for the bottom 30% income households at 6.5 percent in March 2024, followed by Pangasinan with 4.3 percent, and Ilocos Norte with 3.1 percent. Meanwhile, Ilocos Sur recorded a 1.2 percent annual growth.
Compared to their respective levels in March 2023, all the provinces recorded lower inflation rates.
SGD. ATTY. SHEILA O. DE GUZMAN, CPA
Regional Director
| Attachment | Size |
|---|---|
|
|
33.18 MB |