

Release Date :
Reference Number :
2019-7
La Union’s CPI posted at 112.8 in January 2019
The Consumer Price Index (CPI) in La Union in January 2019 was posted at 112.8. This means that on the average, prices of goods and services in the province have increased by 12.8 percent from the base year (2012). The province’s CPI was recorded at 113.1 in December 2018 and at 109.2 in January of the previous year.
Region I’s CPI in January 2018 is 112.5, while in January 2019 the recorded CPI was118.1, therefore, Region I’s CPI increased by 4.6 percentage points.
La Union inflation further slows down in January 2019
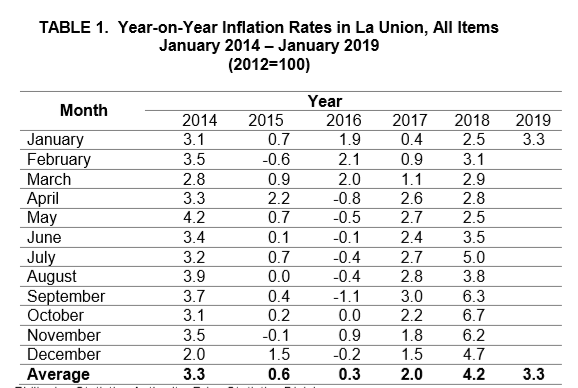
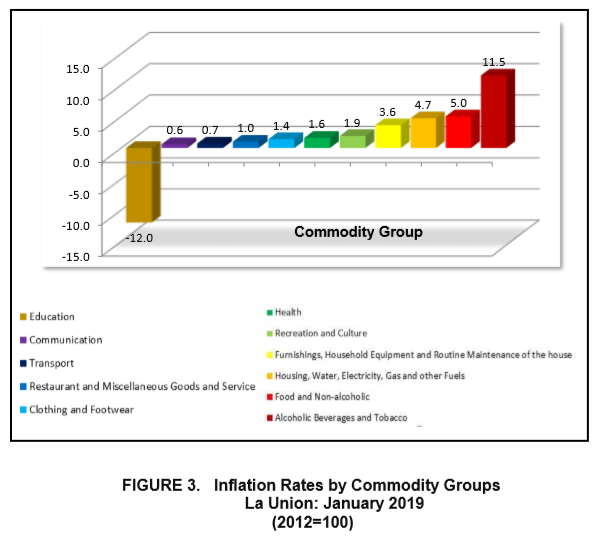
Headline inflation in La Union further slowed down to 3.3 percent in January 2019. The recorded rate was lower by 1.4 percentage points as compared to the previous month which was recorded at 4.7 percent but 0.8 percentage points higher if compared to January of last year at 2.5percent.
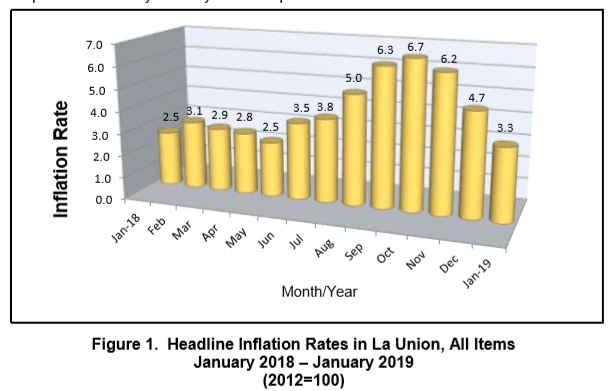
The province’s inflation rate closed at an average of 4.2 percent in 2018. Said rate was 2.2 percentage points higher than the average inflation rate in 2017. The province’s inflation rate peaked at 6.7 percent in October 2018, before it slowly crawled down to 6.2 percent and 4.7 percent in November and December respectively. The province’s inflation rate was optimistic in the first month of 2019 at 3.3 percent.
Region I’s headline inflation in January 2019 also further slowed down to 5.0 percent. Inflation in the Ilocos Region a month ago was posted at 7.0 percent and 3.1 percent. in January 2018.
From December 2018 to January 2019, decreases were posted in the indices of food and non-alcoholic beverages (7.5% to 5.0%); housing, water, electricity, gas and other fuels (5.0% to 4.7%); and transport (1.4% to 0.7%).
The annual gain in the province’s food alone index eased to 4.9 percent in January from 7.0 percent in December 2018. The annual growth in the non-alcoholic beverages index also eased to 8.1 percent from its previous month’s rate of 14.8 percent.
Relative to their previous month’s annual rates, decreases were also noted in the indices of bread and cereals (9.8% to 4.0%); rice (12.4% to 5.0%); fruits (5.3% to 1.1%); and vegetables (16.3% to 12.8%); similarly, a decline in products not elsewhere classified (3.9% to 3.3%); fish (6.7% to 8.0%); meat (4.5% to 2.8%); milk, cheese and eggs (1.1% to 0.9%); oils and fats (2.5% to 2.4%); sugar, jam, honey, chocolate and confectionery (11.9% to 11.5%). While other cereals, flour, cereal preparation, bread, pasta and other bakery products remained at 0.9%.
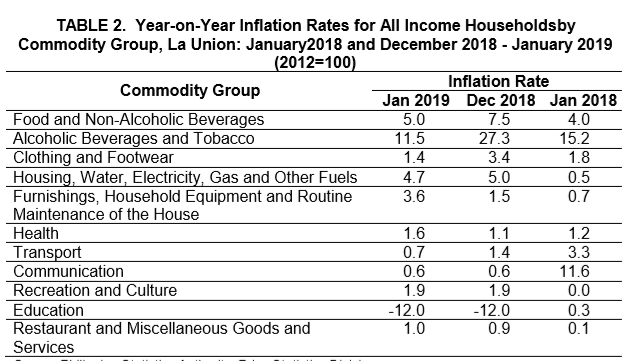
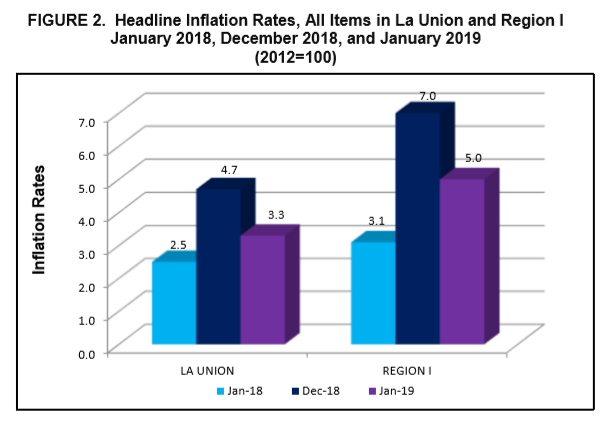
From December 2018 to January 2019, increase in inflation rates were posted in the indices of furnishings, water, household equipment and routine maintenance of the house (1.6% to 3.6%); health (1.1% to 1.6%); restaurant and miscellaneous goods and services (0.9% to 1.0%). Decrease in inflation rates were posted in the indices of food and non-alcoholic beverages (7.5% to 5.0%); alcoholic beverages and tobacco (27.3% to 11.5%); clothing and footwear (3.4% to 1.4%); housing, water, electricity, gas and other fuels (5.0% to 4.7%); and transport (1.4% to 0.7%). While the indices of communication; recreation and culture; and education remained the same at 0.6%, 1.9% and -12.0% respectively.
PPP in La Union remains at Php 0.89 in January 2019 
The Purchasing Power of the Peso (PPP) in La Union was posted at PhP 0.89 in January 2019. This means that the purchasing capability of PhP 1.00 in 2012 decreased by 11 centavos in January 2019. La Union’s PPP was recorded at PhP 0.88 in December 2018 and at PhP 0.92 in January 2018.
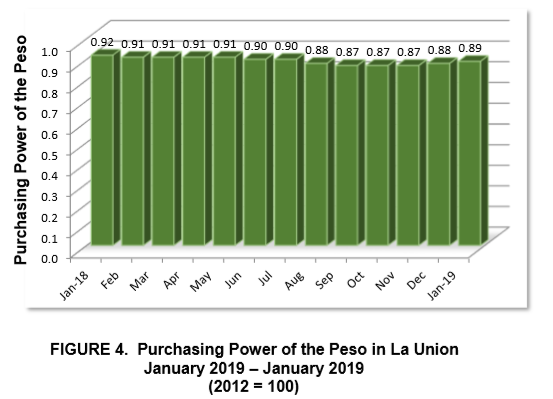
From January 2018, the PPP in the province was pegged at PhP 0.92 decreased to PhP 0.91 in February 2018. It remained the same until May 2018. La Union’s PPP again declined in June 2018 at PhP 0.90 till July 2018. It went down to PhP 0.88 in August 2018 and continued to decline in September 2018 at PhP 0.87. The PPP in province remained at PhP 0.87 until November 2018. For the first time in 2018, the province’s PPP went up by a centavo in December 2018 (PhP 0.88). The province’s PPP went up again by a centavo on the first month of 2019.
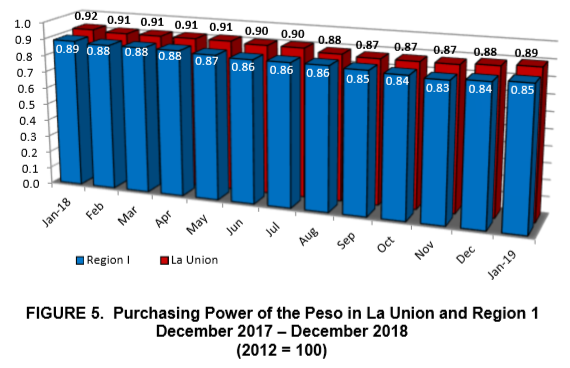
La Union’s PPP in January 2019 was higher than Region I’s PPP of PhP 0.85. The region’s PPP was posted at PhP 0.85 in December 2018 and at PhP 0.89 in January 2018.

The Philippine Statistics Authority generates and announces the monthly Consumer Price Index (CPI) based on a nationwide survey of prices for a given basket of goods and services.
The CPI  is an indicator of the change in the average retail prices of a fixed basket of goods and services commonly purchased by households relative to a base year. It shows how much on the average, prices of goods and services have increased or decreased from a particular reference period known as base year. It also serves as a basis for economic analysis, collective bargaining agreements, for wage adjustments, and for monitoring the effects of government economic policy on households.
Rebasing of CPI to Base Year 2012 and Adopting the Chain Method in the 2012-based CPI
The Philippine Statistics Authority (PSA) released the Consumer Price Index (CPI) for All Income Households with base year 2012 on 06 March 2018. The 2012-based CPI is the tenth in the rebasing series. This was announced in press release number 2018-031 dated 22 February 2018. Data users can expect two sets of the CPI as the new series shall be issued simultaneously with the 2006-based series until June 2018. The CPI series for July 2018 onwards shall be 2012-based.
- Identification of the Base Year

The base period is the period, usually a year, at which the index number is set to 100. It is the reference point of the index number series. The CPI is now rebased to 2012 base year from the current 2006 base year.
The year 2012 was chosen as the next base year because it was the latest year when the Family Income and Expenditure Survey (FIES) results were made available. It is also in accordance with PSA Board Resolution No. 1, Series of 2017-146, which approved the synchronized rebasing of the price indices to base year 2006 and every six (6) years thereafter.
- Determination of the Market Basket

Market basket refers to a sample of goods and services, which is meant to represent the totality of all goods and services purchased by households relative to a base year.
Determining the right market basket is crucial because inadequate representation of the typical basket will give wrong signals as to the behavior of prices, a very important factor in economic planning.
To determine the commodities that will form the market basket for the 2012-based CPI, the updating of the 2006 basket through the Survey of Key Informants was conducted from 07 October to 15 November 2013. The survey was conducted nationwide to store managers, sellers or proprietors and were asked of the most commonly purchased items or commodities. The commodities are grouped according to the 2010 Philippine Classification of Individual Consumption According to Purpose (COICOP) which is based on the United Nations COICOP.
- Determination of the Household Consumption Patterns (Weights)
This activity involves assigning weights to the commodity groups/sub-groups. This reflects the consumption priorities of households and the way they allocate resources to meet their needs. Weight is a value attached to a commodity or group of commodities to indicate the relative importance of that commodity or group of commodities in the market basket.
The weights for the 2012-based CPI were derived from the expenditure data of the 2012 FIES, a survey that covered around 50,000 sample households nationwide. The weight for each item of expenditure is a proportion of that expenditure item to the total national expenditure. The total (all items) national expenditure weights is equal to 100.
The 2012 FIES expenditure data were used to directly estimate the 2012 CPI weights at the national and regional levels. However, the 2012 FIES estimates for the expenditure data at the provincial level were not directly utilized in estimating the CPI expenditure weights as the data at the provincial/city level may not be reliable with the use of the households’ master sample (MS) that was utilized in selecting the 2012 FIES sample households. The MS was drawn using regions as domains in generating estimates in all the household surveys of the PSA starting July 2003.

The provincial/city expenditure data were derived using the model-based method in small area estimation procedures using the regional expenditure data as the control total for all the expenditure data within the specific region. Using these estimates, the weight for each item of expenditure is computed as a proportion of that item of expenditure to the total national expenditure. A raking procedure was done to adjust the weights of the provinces so that the provincial weights when added up will equal to the regional weights.
- Monitoring of Prices of Items in the Market Basket
This involves establishing baseline information for prices of the items in the base year and monitoring the prices of the items on a regular basis. Collection of data for the CPI is done by the provincial staff of the PSA. Except for food, beverage and tobacco (FBT) in the National Capital Region(NCR) and petroleum products which are monitored on a weekly basis, price collection is generally done twice a month. First collection phase is done in the first five days of the month while the second phase is on the 15th to 17th day of the month. Data are collected from the sample outlets (outlets or establishments where prices of commodities/services are collected or quoted) which were chosen using the following criteria:
- Popularity of an establishment along the line of goods to be priced – this means the sample outlet is publicly noted in the locality for selling goods included in the CPI market basket and the outlet is patronized by a large segment of the population.
- Consistency and completeness of stock
Consistency of stock – the outlet has a constant, steady or regular stock of commodities listed in the CPI price collection forms as well as of those commodities of the same kind and belonging to the same commodity group.
Completeness of stock – the sample outlet carries in its stock many if not all of the items included in the CPI price collection forms relative to the other outlets in the area.
- Permanency of outlet – the outlet is an established store or stall in the market area. It should not be an ambulant or transient vendor in order that the collection of data can be done for the succeeding survey rounds.
- Geographical location – the outlet is conveniently located and is accessible to the majority of consumers in the area.
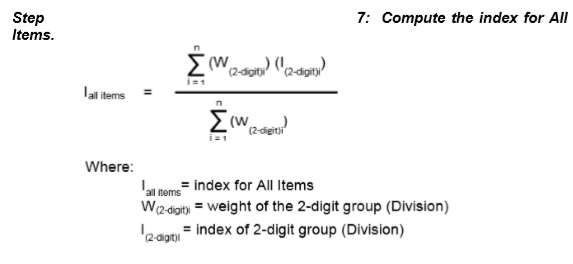
- Computation of the CPI
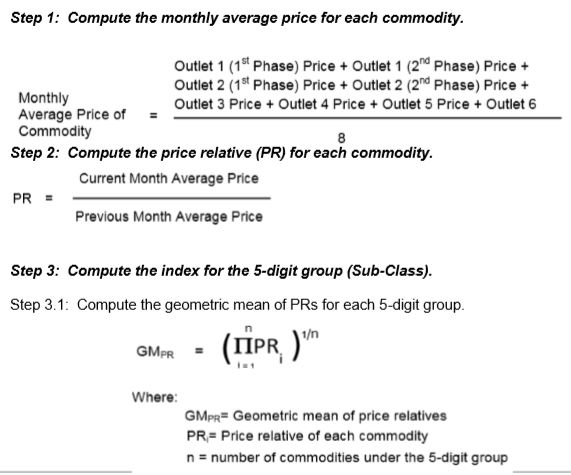
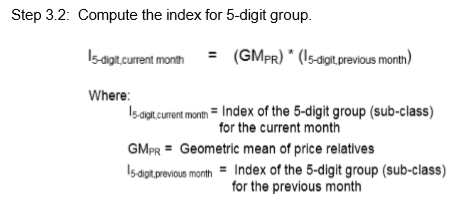
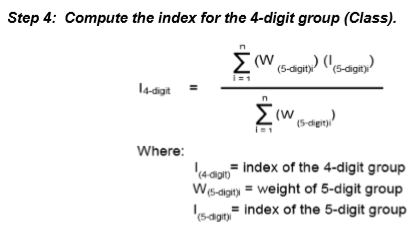
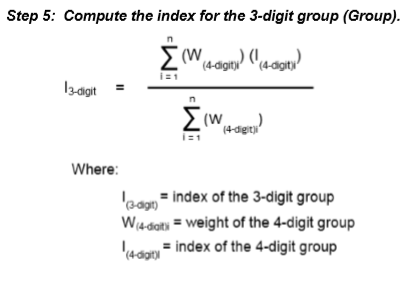
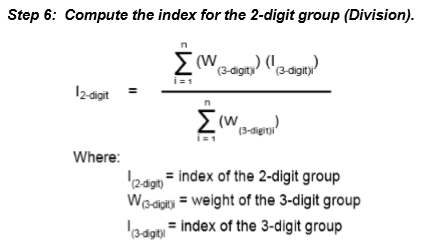
The PSA employed the weighted arithmetic mean of price relatives and the “Chain” method to provide timely indicators since this method allows the inclusion or exclusion of commodities in the market basket to address the changing consumer taste and preferences and technological changes. Below are the steps in the computation of CPI using the 2012 as the base year:
Economic Indicators Derived from the CPI
Two important indicators, the inflation rate and purchasing power of the peso (PPP), are derived from the CPI which are important in monitoring price stability and the value of the country’s currency.
Inflation Rate is the annual rate of change or the year-on-year change of the CPI expressed in percent. The formula is:
Inflation Rate = 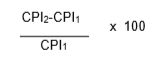
Where:CPI2 – is the CPI in the second period
CPI1 – is the CPI in the previous period

Headline Inflation is the rate of change in the weighted average prices of all goods and services in the CPI basket while Core Inflation refers to the rate of change in the CPI that excludes the following item/commodity groups: rice, corn, fruits and vegetables, and fuel items.
The PPP  measures the real value of the peso in a given period relative to a chosen reference period. It is computed by getting the reciprocal of the CPI and multiplying the result by 100.
PPP=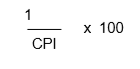
NIÑO E. TUAZON
(Supervising Statistical Specialist)
Officer-in-Charge
| Attachment | Size |
|---|---|
|
|
489.79 KB |