

Release Date :
Reference Number :
2024-033
Reference Period
2024
Ilocos Region
I. Overall Inflation
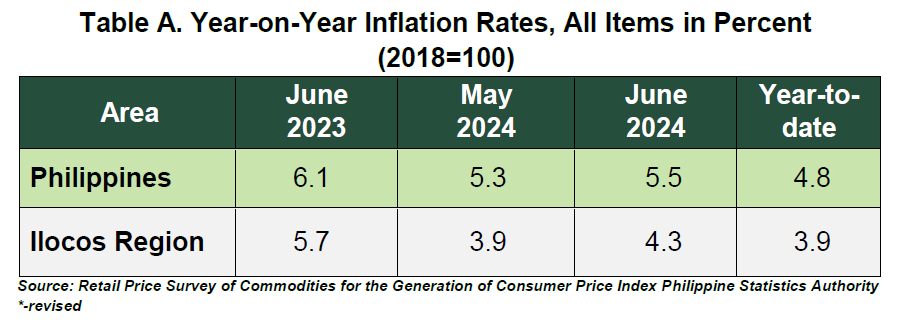
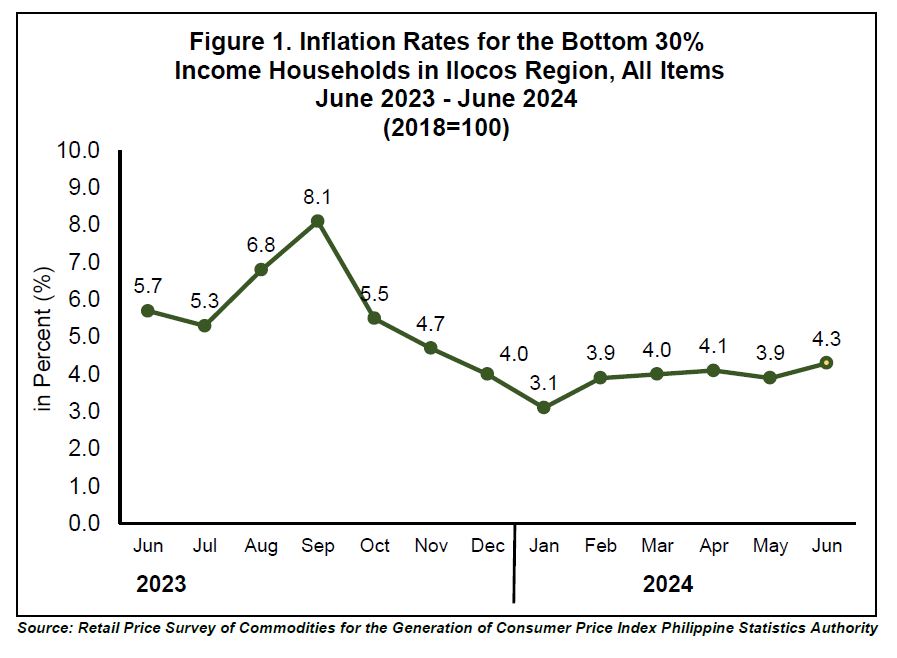
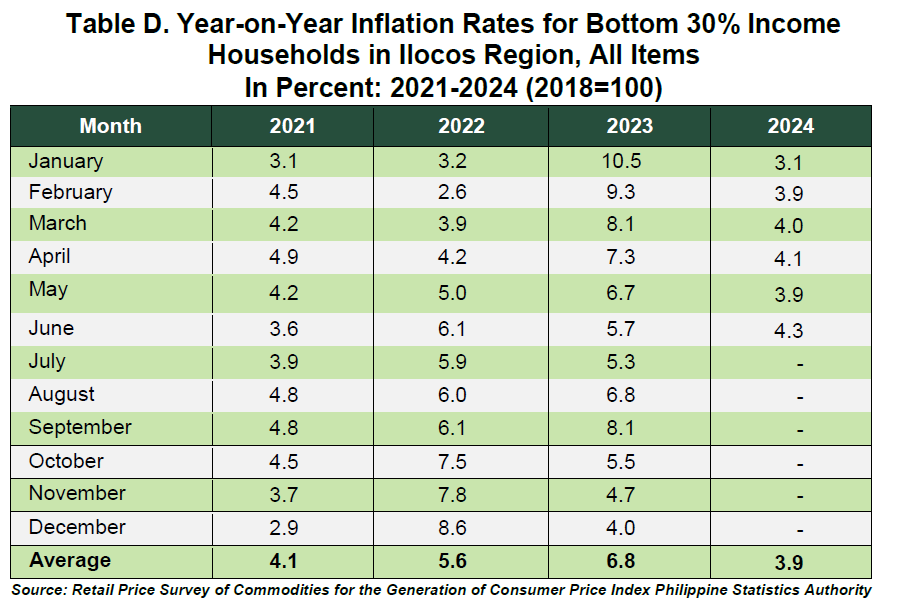
The inflation rate of the Ilocos Region for the bottom 30% income household increased to 4.3 percent in June 2024 from 3.9 percent in May 2024, higher by 0.4 percentage point. On the other hand, it is lower by 1.4 percentage points from the rate of 5.7 percent in June 2023.
1.1 Main Drivers to the Upward Trend of the Overall Inflation
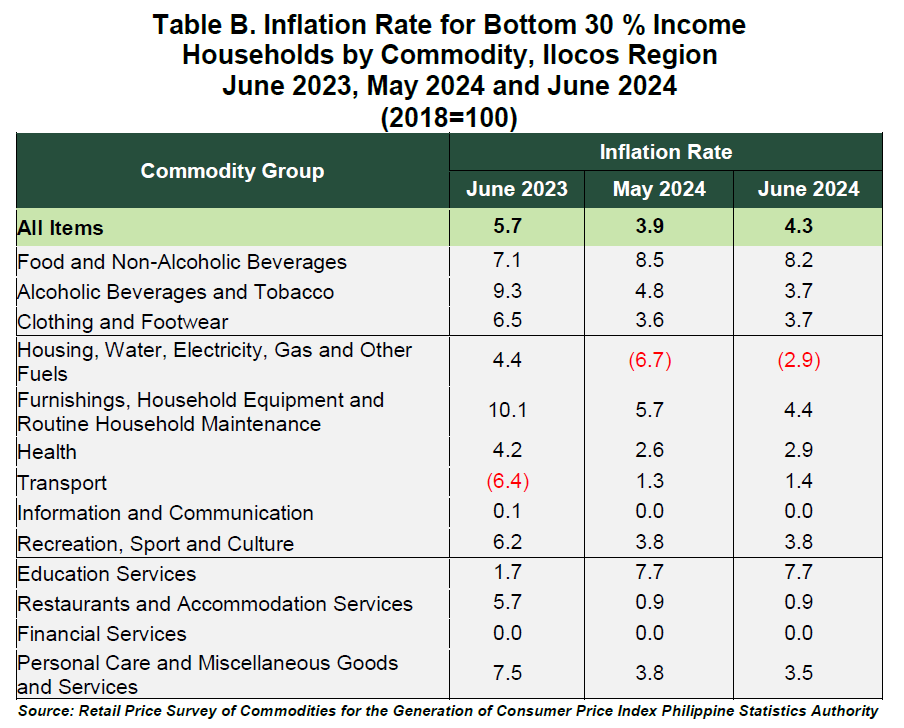
The upward trend of the overall inflation for the bottom 30% income households in June 2024 was primarily contributed by housing, water, electricity, gas and other fuels. Slower annual decrease was noted in the index of this commodity group at 2.9 percent from 6.7 percent annual decline in the previous month.
Higher annual growth rates were also observed in the following commodity groups during the month of June 2024:
a. Transport, 1.4 percent from 1.3 percent;
b. Health, 2.9 percent from 2.6 percent; and
c. Clothing and footwear, 3.7 percent from 3.6 percent.
On the other hand, decreased indices compared to their previous month’s rates were observed in the following commodity groups:
a. Food and non-alcoholic beverages, 8.2 percent from 8.5 percent;
b. Alcoholic beverages and tobacco, 3.7 percent from 4.8 percent;
c. Furnishings, household equipment and routine household maintenance, 4.4 percent from 5.7 percent; and
d. Personal care, and miscellaneous goods and services, 3.5 percent from 3.8 percent.
The rest of the commodity groups retained their previous month’s inflation rates or had zero percent annual growths. (Table B)
1.2 Main Contributor to the Overall Inflation
The following commodity groups were the top three contributors to the June 2024 overall inflation for the bottom 30% income households:
a. Food and non-alcoholic beverages, 93.3 percent share or 4.0 percentage points;
b. Personal care, and miscellaneous goods and services, 4.6 percent share or 0.2 percentage point; and
c. Restaurants and accommodation services, 2.9 percent share or 0.1 percentage point.
II. Food Inflation
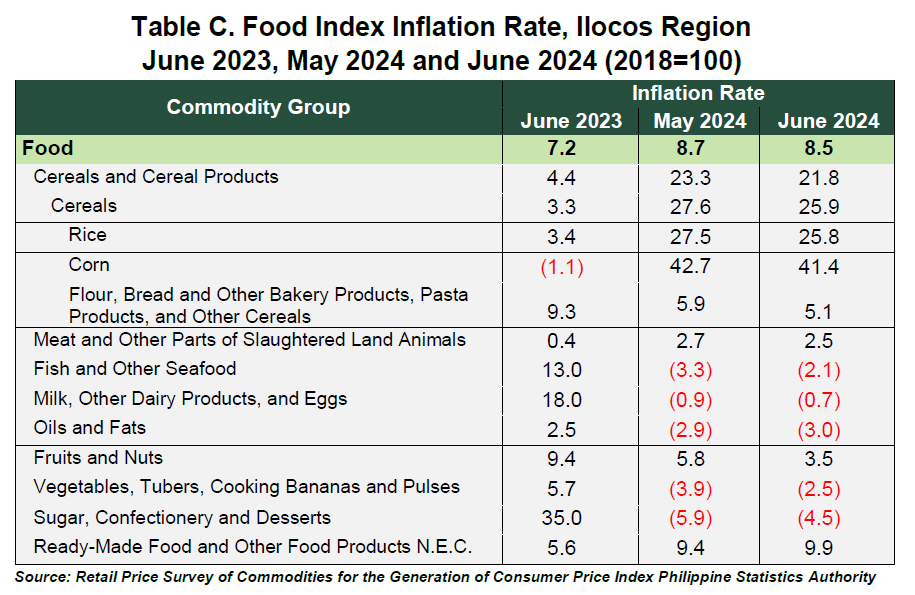
Food inflation for the bottom 30% income households at the regional level moved at a slower pace of 8.5 percent in June 2024 from 8.7 percent
in the previous month. In June 2023, its annual increase was observed at 7.2 percent.
2.1 Main Drivers to the Downward Trend of the Food Inflation
The deceleration of food inflation was mainly due to the faster annual decrease in the index of cereals and cereal products like rice, corn, flour, bread and other bakery products, pasta products, and other cereals at 21.8 percent in June 2024 from 23.3 percent in May 2024. Likewise, indices of the following food groups posted annual decreases in June 2024:
a. Meat and other parts of slaughtered land animals (ND), 2.5 percent from 2.7 percent;
b. Oils and fats (ND), -3.0 percent from -2.9 percent; and
c. Fruits and nuts (ND), 3.5 percent from 5.8 percent.
On the other hand, higher annual growth rates were observed in the following food groups during the month of June 2024:
a. Fish and other seafood, -2.1 percent from -3.3 percent;
b. Milk, other dairy products and eggs, -0.7 percent from -0.9 percent;
c. Vegetables, tubers, plantains, cooking bananas and pulses, -2.5 percent from -3.9 percent;
d. Sugar, confectionery and desserts, -4.5 percent from -5.9 percent; and
e. Ready-made food and other food products, 9.9 percent from 9.4 percent.
2.2 Main Contributors to the Food Inflation
Food inflation contributed 89.1 percent or 3.8 percentage points to the June 2024 overall inflation for this particular income group. The top three main contributors to the food inflation during the month were the following:
a. Cereals and cereal products, 98.2 percent share or 8.3 percentage points;
b. Meat and other parts of slaughtered land animals, 4.0 percent share or 0.3 percentage points; and
c. Ready-made food and other food products, 3.9 percent share or 0.3 percentage point.
Provinces

Among the provinces, La Union posted the highest inflation rate
for the bottom 30% income households at 7.0 percent in June 2024, followed by Pangasinan with 4.0 percent. Meanwhile, Ilocos Norte
and Ilocos Sur both posted 3.7 percent annual growth.
Compared to their respective levels in June 2023, only La Union posted higher inflation rate.
SGD. MELLEN M. BORJA
Senior Statistical Specialist
(Officer-in-Charge)
Per SO No. RSSO I-2401-0362
Dated 08 July 2024
for:
ATTY. SHEILA O. DE GUZMAN
Regional Director
Regional Statistical Services Office 01
| Attachment | Size |
|---|---|
|
|
4.16 MB |