

Release Date :
Reference Number :
2023-26
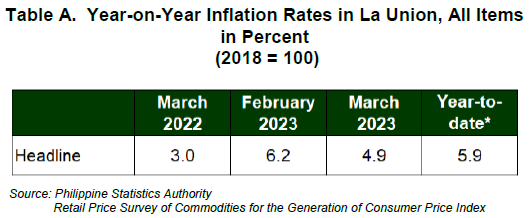
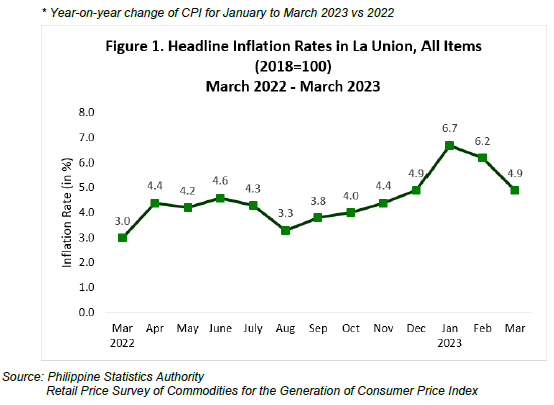
Headline inflation in La Union decelerated to 4.9 percent in March 2023, from 6.2 percent in February 2023. In March 2022, inflation was lower at 3.0 percent. The average inflation from January to March 2023 was recorded at 5.9 percent. (Table A and Figure 1)
The slowdown of inflation in La Union in March 2023 was primarily brought about by the deceleration of the inflation rate in the transport index at 6.9 percent, from 14.3 percent in February 2023. Contributing as well to the downtrend were: housing, water, electricity, gas and other fuels with inflation rate of 3.7 percent, from 6.4 percent; food and non-alcoholic beverages with inflation rate of 7.7 percent, from 8.4 percent; and personal care, and miscellaneous goods and services with inflation rate of 3.2 percent, from 3.5 percent.
On the contrary, higher annual increases were observed in the indices of health at 2.7 percent; clothing and footwear at 4.3 percent; and information and communication at 1.4 percent.
Meanwhile, the indices of the following commodities remained at their previous month’s annual rates:
-
Alcoholic beverages and tobacco, 6.4 percent;
-
Furnishings, household equipment and routine household maintenance, 2.1 percent;
-
Recreation, sport and culture, 2.8 percent;
-
Education services, -0.4 percent;
-
Restaurants and accommodation services, 0.1 percent; and
-
Financial services, 0.0 percent.
Similarly, food inflation at the provincial level slowed down to 8.1 percent in March 2023, from 8.8 percent in February 2023. In March 2022, food inflation was recorded at 1.1 percent.
Lower annual increases in the indices of vegetables, tubers, cooking bananas and pulses at 19.8 percent; meat and other parts of slaughtered land animals at 2.0 percent; and sugar, confectionery and desserts at 36.7 percent were the main contributors to the deceleration of food inflation in the province in March 2023.
Moreover, lower year-on-year mark-ups during the month were also noted in the indices of the following food groups:
-
Fruits and nuts, 7.1 percent;
-
Flour, bread and other bakery products, pasta products, and other cereals, 6.9 percent;
-
Oils and fats, 13.8 percent; and
-
Ready-made food and other food products not elsewhere classified (n.e.c), 5.8 percent.
On the contrary, higher annual growth rates were observed in the indices of the following food groups in March 2023:
-
Fish and other seafood, 11.3 percent;
-
Rice, 2.0 percent; and
-
Milk, other dairy products, and eggs, 16.4 percent.
Meanwhile, the index of corn remained at its previous month’s rate of 0.0 percent.
SGD. DANITES E. TEÑIDO, Ph.D.
Chief Statistical Specialist
/MMAAA