

Release Date :
Reference Number :
2025-07
Reference Period
February 2025
1. Provincial Headline Inflation
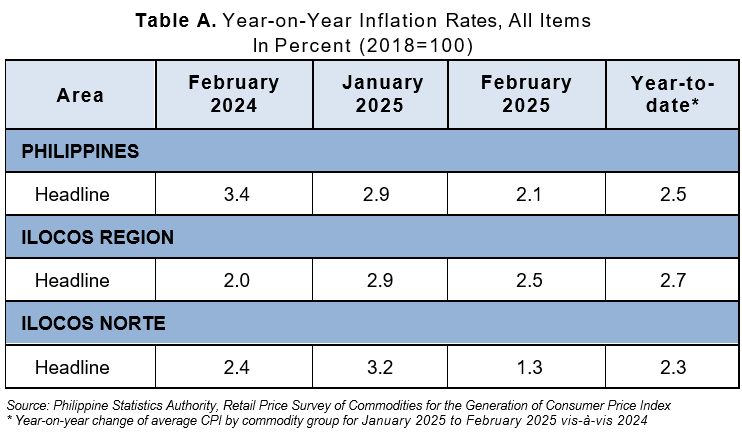
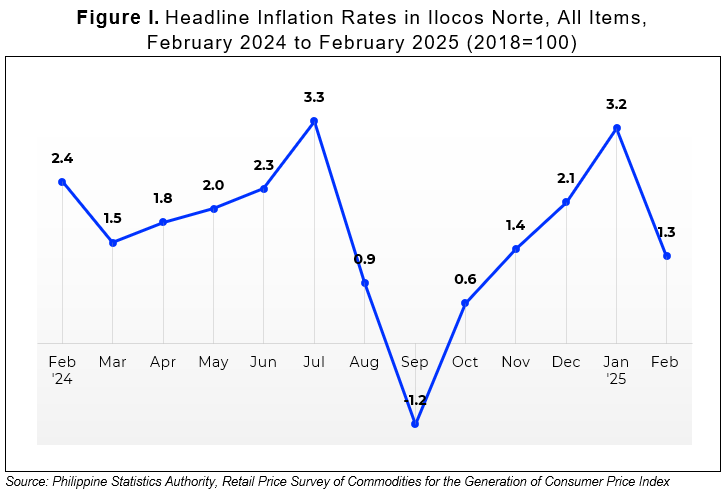
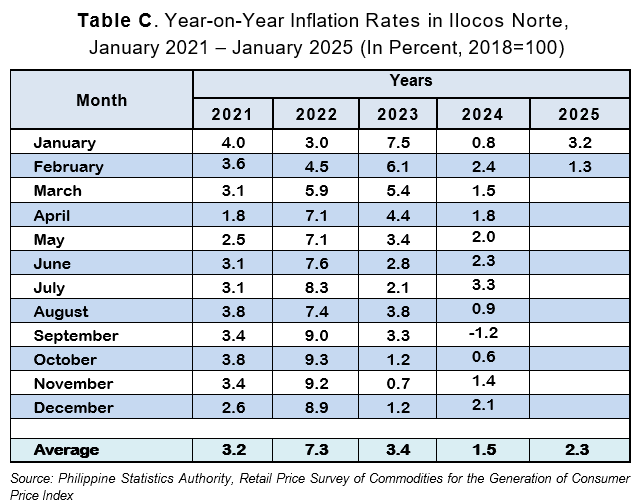
The provincial headline inflation slowed down to 1.3 percent in February 2025, a 1.9 percentage point decrease from 3.2 percent in January 2025. The recorded rate is 0.8 percentage points lower than the national inflation rate of 2.1 percent in February 2025. (Tables A, B & C, and Figure I)
1.1 Main Drivers to the Downward Trend of the Headline Inflation
The downward trend was primarily driven by a decrease in the heavily weighted food and non-alcoholic beverages from 3.8 percent in January 2025 to negative 1.8 percent in February 2025. The price of vegetables, tubers, plantains, cooking bananas and pulses contributed the largest increase in the commodity group as its inflation rate moved from 56.3 percent in January 2025 to 1.8 percent in February 2025. The continued reduction in the price of cereals and cereal products from negative 2.7 percent to negative 9.6 percent also contributed to the downward trend.
The decrease in the year-on-year rate for the following commodity groups also played a significant factor in sustaining the upward trend:
a. Alcoholic beverages and tobacco, from 5.1 percent to 4.8 percent; and
b. Transport, from 2.4 percent to 1.7 percent.
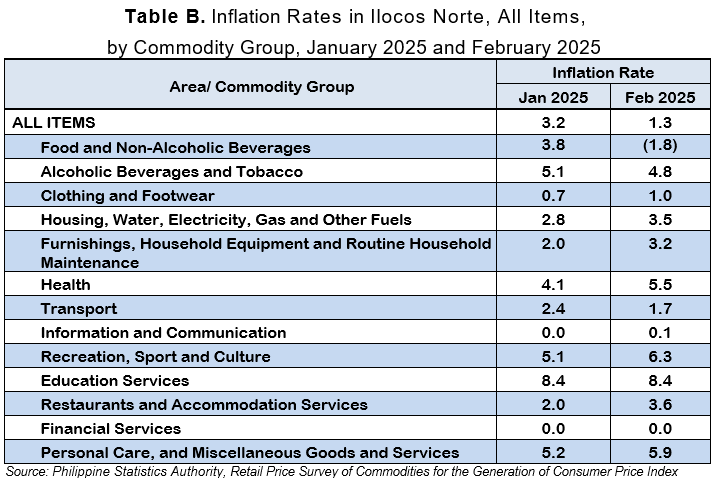
Consequently, the index for education services moved at its previous month’s annual rate of 8.4 percent.
On the contrary, higher price indices were observed for the following commodity groups:
a. Clothing and footwear, from 0.7 percent to 1.0 percent;
b. Housing, water, electricity, gas and other fuels, from 2.8 percent to 3.5 percent;
c. Furnishings, household equipment and routine household maintenance, from 2.0 percent to 3.2 percent;
d. Health, from 4.1 percent to 5.5 percent;
e. Information and Communication; from zero percent to 0.1 percent;
f. Recreation, sport and culture, from 5.1 percent to 6.3 percent;
g. Restaurants and accommodation services, from 2.0 percent to 3.6 percent; and
h. Personal care, and miscellaneous goods and services, from 5.2 percent to 5.9 percent.
Financial services continued to record a zero percent annual rate. (Table B)
1.2 Main Contributors to Provincial Headline Inflation
The top three commodity groups contributing to the February 2025 provincial headline inflation were the following:
a. Housing, water, electricity, gas and other fuels with 48.4 percent share or 0.63 percentage points; and
b. Restaurants and accommodation services with 28.8 percent share or 0.37 percentage points; and
c. Personal care, and miscellaneous goods and services with 19.5 percent share or 0.25 percentage points.
2. Food Inflation
At the provincial level, food inflation declined to negative 2.1 percent in February 2025 from 3.9 percent in January 2025. This is 4.7 percentage points lower than the national food inflation rate of 2.6 percent. In February 2024, the provincial food inflation rate was higher at 9.2 percent.
2.1 Main Drivers to the Downward Trend of Food Inflation
The reduction in the overall food prices in the province for February 2025 was primarily driven by the decrease in the year-on-year price of vegetables, tubers, plantains, cooking bananas and pulses to 1.8 percent from 56.3 percent in January 2025.
A slower rate of increase in the price index was also observed for the following food groups:
a. Rice, from negative 4.2 percent to negative 13.3 percent;
b. Corn, from 13.7 percent to 8.3 percent; and
c. Fish and other seafood (ND), from 0.5 percent to negative 1.9 percent.
On the other hand, an increase in the indices of the following food groups was observed during the reference month:
a. Flour, bread and other bakery products, pasta products, and other cereals, from 1.7 percent to 2.2 percent;
b. Meat and other parts of slaughtered land animals (ND), from negative 2.5 percent to 0.7 percent;
c. Milk, other dairy products and eggs (ND), from 1.1 percent to 2.3 percent;
d. Oils and fats (ND), from 1.7 percent to 2.5 percent;
e. Fruits and nuts (ND), from 7.4 percent to 8.1 percent;
f. Sugar, confectionery and desserts (ND), from negative 1.4 percent to negative 0.1 percent; and
g. Ready-made food and other food products n.e.c. (ND), from 5.7 percent to
6.4 percent.
2.2 Main Contributors to Food Inflation
Food inflation recorded a negative 47.7 percent share of provincial inflation in February 2025. The food groups with the highest contribution to food inflation during the month were the following:
a. Cereals and cereal products (ND), with 132.0 percent share or negative 2.77 percentage points;
b. Fish and other seafood (ND), with 12.4 percent share or negative 0.26 percentage points; and
c. Sugar, confectionery and desserts (ND), with a 0.1 percent share or 0.0 percentage points.
SGD. MARILYN P. VERGARA
Chief Statistical Specialist
Ilocos Norte Provincial Statistical Office
/RPS
| Attachment | Size |
|---|---|
|
|
192.14 KB |