

Release Date :
Reference Number :
2019-16
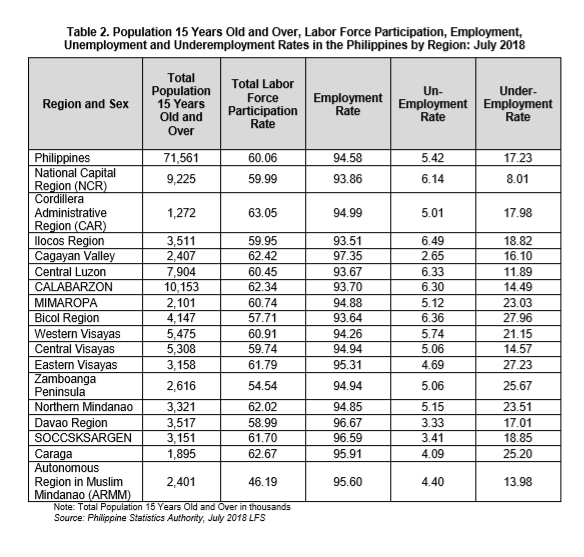
The results of the July 2018 Labor Force Survey (LFS) showed an employment rate of 93.5 percent for Ilocos Region. This was 1.7 percentage points higher than the employment rate recorded in July 2017 at 91.8 percent. Compared with the 94.6 percent national figure, Ilocos Region’s employment rate was lower by 1.1 percentage points. The Labor Force Participation Rate (LFPR) of the region in July 2018 was posted at 59.9 percent given the population 15 years old and over of 3.5 million. This showed an increase of 1.2 percentage points from the 58.7 percent LFPR of the region in July 2017.
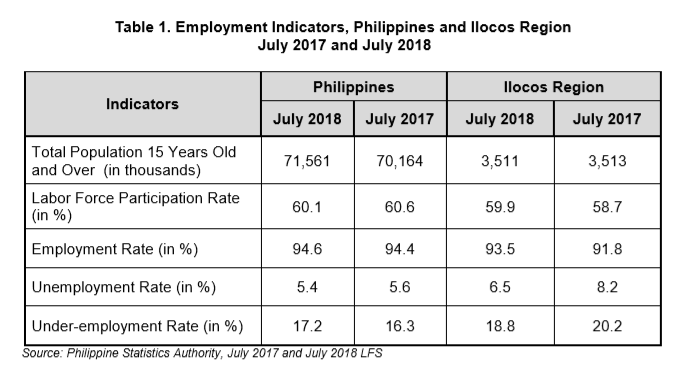
Meanwhile, the employment rate of the country in July 2018 was slightly higher by 0.2 percentage point than the employment rate recorded in July 2017 at 94.4 percent. The country’s LFPR in July 2018 was estimated at 60.1 percent given the population 15 years old and over of 71.6 million. In July 2017, the country’s LFPR was recorded at 60.6 percent.
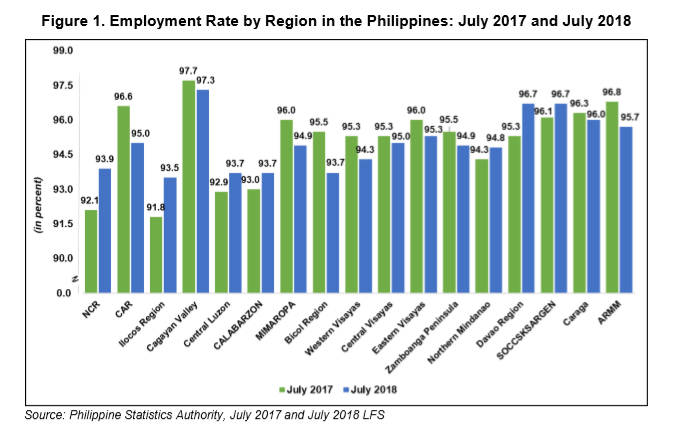
Among the 17 regions in the country, Cagayan Valley posted the highest employment rate of 97.3 percent in July 2018. On the contrary, Ilocos Region recorded the lowest employment rate.
National Capital Region (NCR) posted the highest increase in employment rate with 1.8 percentage points from 92.1 percent in July 2017 to 93.9 percent in July 2018. On the other hand, Cordillera Administrative Region (CAR) recorded the biggest decrease of 1.6 percentage points from 96.6 percent in July 2017 to 95.0 percent in July 2018.
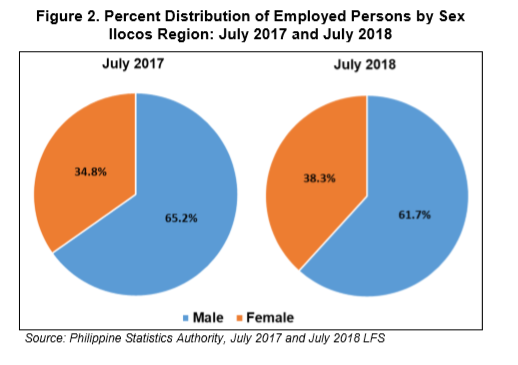
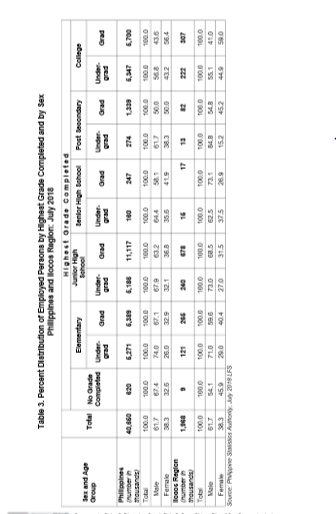
Males (61.7%) dominated females (38.3%) in terms of employment in July 2018. Similarly, employed males (65.2%) outnumbered employed females (34.8%) in July 2017.
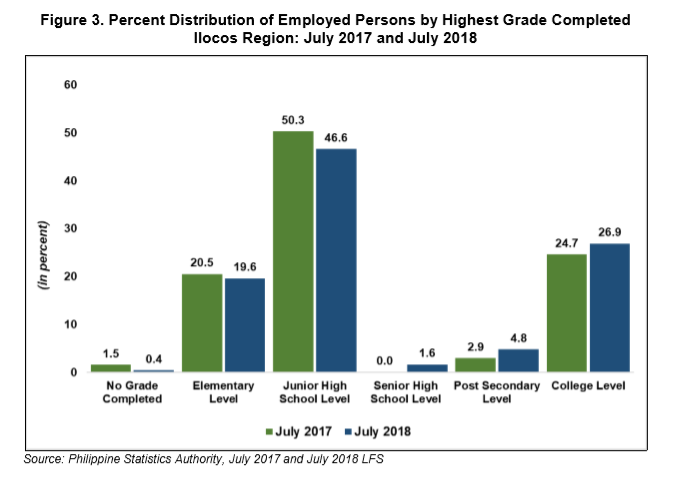
It is manifested in Figure 3 that nearly half (46.6%) of the employed persons in Ilocos Region in July 2018 were either in Junior High School level or graduated from Junior High School. Those who attained college level and elementary level followed accounting for 26.9 percent and 19.6 percent respectively of the total employed persons in the region in July 2018. On the other end, those with no grade completed (0.4%) comprised the smallest proportion of the total employed persons in the region.
Similarly, employed persons who attained Junior High School Level also had the biggest share in July 2017, with 50.3 percent. It was followed by employed persons who reached college level and elementary level with 24.7 percent share and 20.5 percent share respectively. Employed persons who have reached senior high school level recorded the least percent share with less than 0.1 percent of the total employed persons in the region.
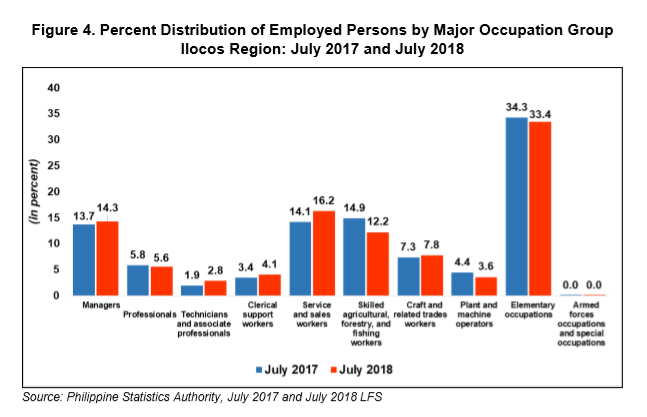
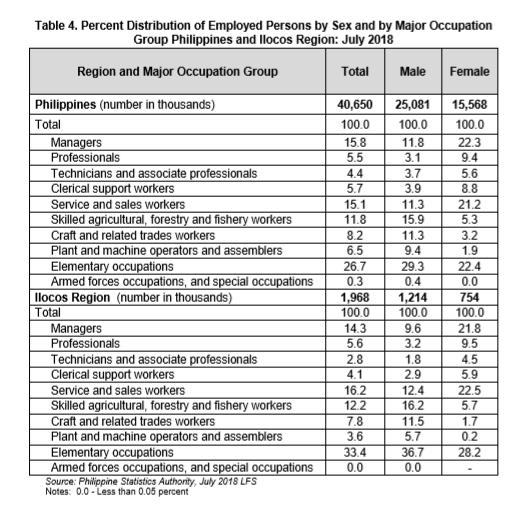
Among the various occupation groups, workers under elementary occupations comprised the biggest group making up 33.4 percent of the total employed persons in Ilocos Region in July 2018. This was followed by service and sales workers with 16.2 percent share and managers with 14.3 percent share.
In July 2017, the top three occupation groups among employed persons in the region were: elementary occupations; skilled agricultural, forestry, and fishing workers; and service and sales workers with 34.3 percent share, 14.9 percent share, and 14.1 percent share respectively.
On the other hand, the smallest occupation group was recorded by the armed forces and special occupations with less than one percent both in July 2017 and July 2018.
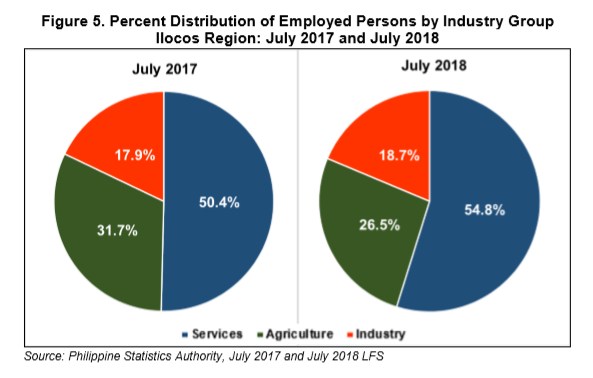
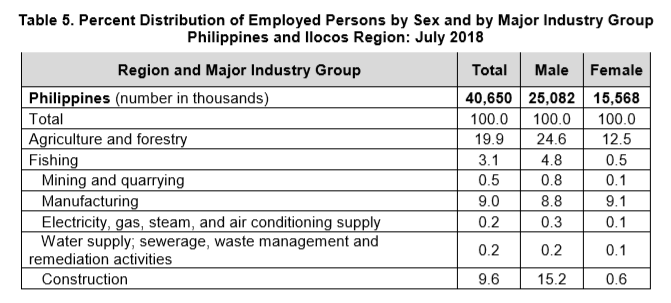
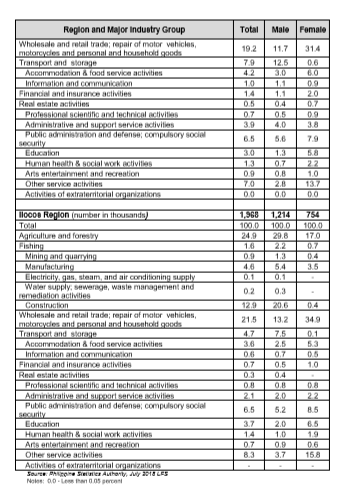
In terms of percent distribution of employed persons by major industry as shown in Figure 5, workers in the services sector comprised the largest group, making up 50.4 percent and 54.8 percent of the total employed persons in Ilocos Region in July 2017 and July 2018 respectively.
This was followed by workers in the agriculture sector with 31.7 percent share and 26.5 percent share in July 2017 and July 2018 respectively.
Meanwhile, workers in the industry sector comprised the smallest proportion of employed persons in the region with 17.9 percent share and 18.7 percent share in July 2017 and July 2018 respectively.
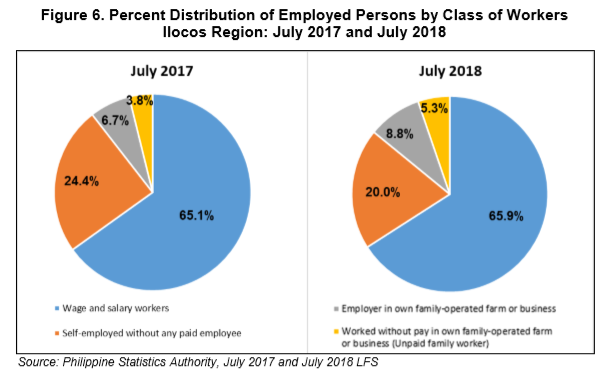
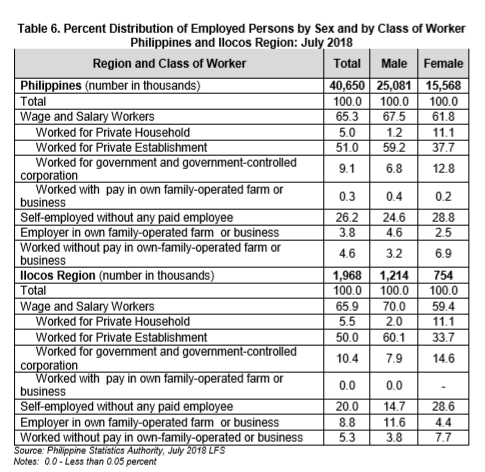
Figure 6 shows that the biggest proportion of employed persons in Ilocos Region in July 2018 was recorded by wage and salary workers with 65.9 percent of the total employed persons. Self-employed without any paid employee ranked second with 20.0 percent share followed by employer in own family-operated farm or business with 8.8 percent share.
Likewise, wage and salary workers also posted the largest share in July 2017 with 65.1 percent of the total employed persons in the region. It was also followed by self-employed without any paid employee and employer in own family-operated farm or business with 24.4 percent share and 6.7 percent share respectively.
On the contrary, workers without pay in own family-operated farm or business (unpaid family worker) accounted for the smallest proportion of the total employed persons in Ilocos Region in July 2017 and July 2018 with 3.8 percent share and 5.3 percent share respectively.
For wage and salary workers group, those who worked in private establishments comprised the biggest group with 50.0 percent share in July 2018. Employed persons in government and government-controlled corporations distantly followed with 10.4 percent share while workers for private households had 5.5 percent share.
In July 2017, employed persons who worked for private establishments also had the biggest proportion among employed persons in the region with 50.7 percent share. Likewise, employed persons who worked for government or government corporations and those who worked for private households followed with 9.9 percent share and 4.1 percent share respectively.
On the other end, the smallest group was posted by employed persons who worked with pay in own family-operated farm or business with negligible share of 0.4 percent and 0.0 percent in July 2017 and July 2018, respectively.
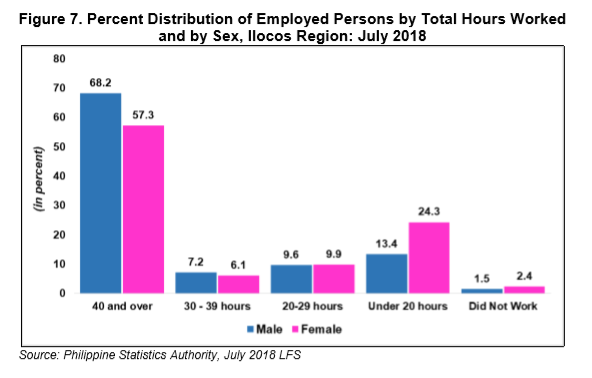
It can be gleaned in Figure 7 that most of the employed persons in Ilocos Region in July 2018 for both sexes worked at least 40 hours a week with 68.2 percent of employed males and 57.3 percent of employed females. This was followed by those who worked under 20 hours a week for both sexes with 13.4 percent for males and 24.3 percent for females and those who worked 20 to 29 hours a week with 9.6 percent males and 9.9 percent females. The smallest proportion of employed persons in the region were not engaged in any work during the reference period comprised of 1.5 percent males and 2.4 percent females.
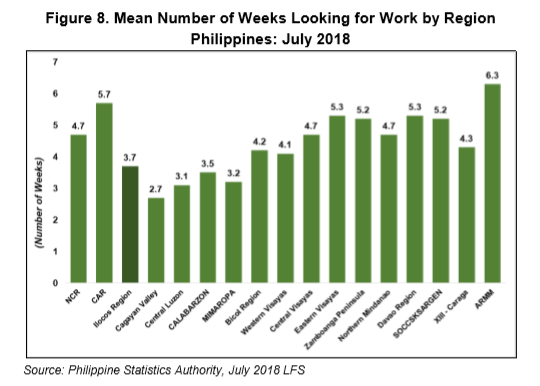
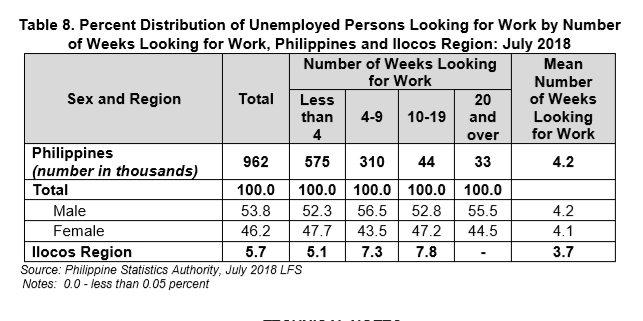
In terms of job hunting, the Autonomous Region in Muslim Mindanao (ARMM) recorded the highest duration of unemployed persons looking for work with an average of 6.3 weeks as shown in Figure 8. Cordillera Administrative Region (CAR) followed with an average of 5.7 weeks for unemployed persons looking for work. Meanwhile, unemployed persons in Ilocos Region posted an average of 3.7 weeks looking for work.
On the other hand, the shortest duration of unemployed persons looking for work was posted by Cagayan Valley with an average of 2.7 weeks.

TECHNICAL NOTES
- Starting July 2003, the LFS adopted the 2003 Master Sample Design, with a sample size of approximately 50,000 households.
- Starting April 2005, the new unemployment definition was adopted per National Statistical Coordination Board (NSCB) Resolution Number 15 dated October 20, 2004. As indicated in the said resolution, the unemployed include all persons who are 15 years and over as of their last birthday and are reported as: (1) without work and currently available for work and seeking work; or (2) without work and currently available for work but not seeking work for the following reasons:
1. Tired/believed no work available
2. Awaiting results of previous job application
3. Temporary illness/disability
4. Bad weather
5. Waiting for rehire/job recall
- Starting with the January 2007 LFS round, the population projections based on the 2000 Census of Population and Housing was adopted to generate the labor force statistics. This is in compliance with NSCB Resolution No. 1 series of 2005 entitled “Adoption of the Methodology Used in Generating the 2000 Census of Population and Housing-Based National Population Projections”.
- The 2012 Philippine Standard Occupational Classification (PSOC) was adopted starting April 2016.
- Starting in the January 2012 LFS, the codes for industry adopted the 2009 Philippine Standard Industrial Classification (PSIC). Prior to this, codes for industry used the 1994 PSIC. More detailed categories for highest grade completed used in the 2010 Census of Population and Housing (CPH) were also adopted. In addition, a question on whether a household member is a graduate of a technical vocational course was asked for each person 15 years or older.
ATTY. SHEILA O. DE GUZMAN
(Chief Administrative Officer)
Officer-in-Charge
| Attachment | Size |
|---|---|
|
|
793.06 KB |