

Release Date :
Reference Number :
2049 - 6
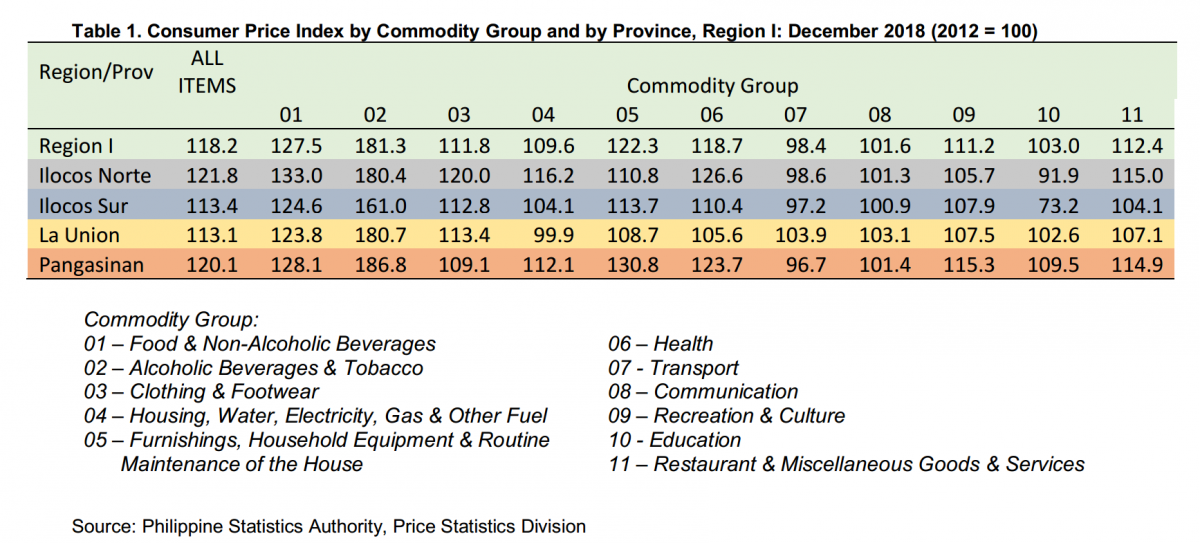
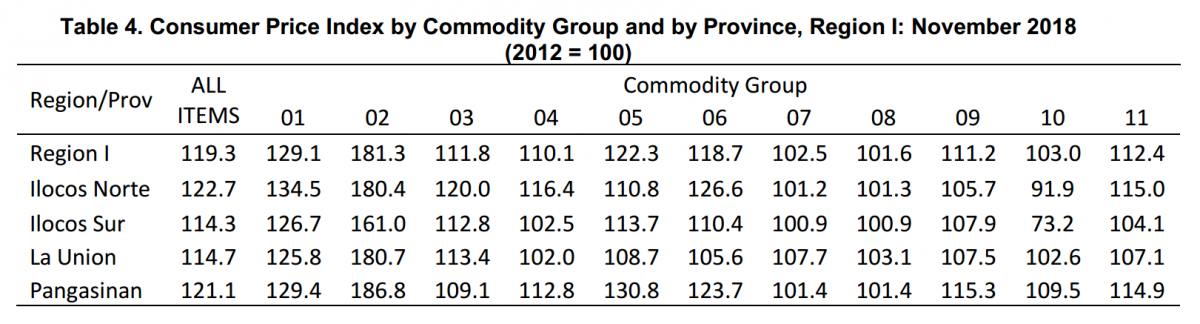
The Consumer Price Index (CPI) of Region I for December 2018 (2012 based) was recorded at 118.2. This figure is 7.7 percentage points lower than the December 2017’s figure of 110.5. In the previous month, the region’s CPI was pegged at 119.3. The top three commodity groups that recorded high price indices were: alcoholic beverages and tobacco (181.3); food and non-alcoholic beverages (127.5); and furnishings, household equipment and routine maintenance of the house (122.3). On the other hand, the bottom three commodity groups with lowest price indices were: transport (98.4); communication (101.6); and education (103.0).
By province, Ilocos Norte posted the highest price index in December 2018 at 121.8 followed by Pangasinan at 120.1 and Ilocos Sur at 113.4. On the other hand, La Union recorded the lowest price index at 113.1.
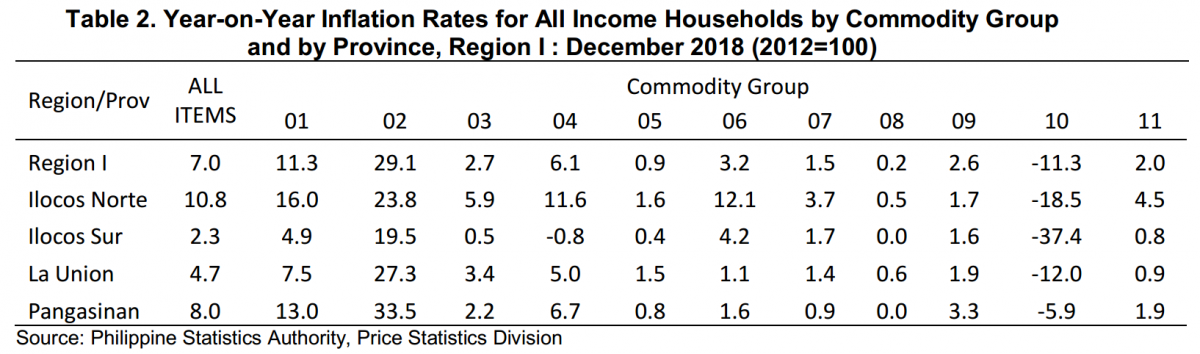
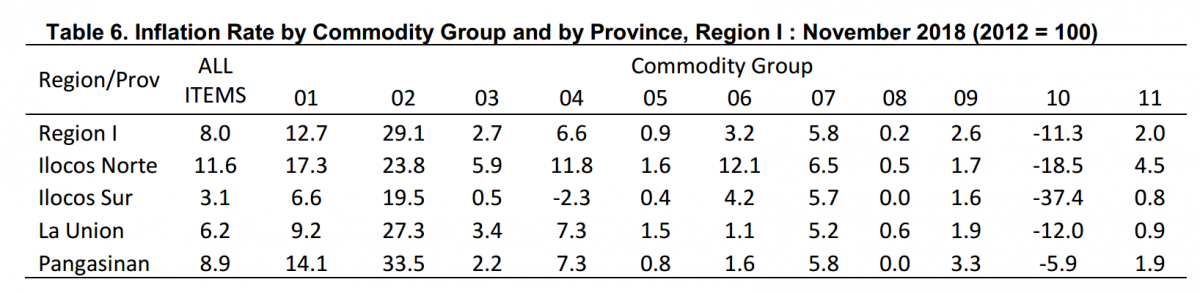
Inflation Rate in Region I decelerates to 7.0 in December 2018
The headline inflation in Region I slowed down to 7.0 percent in December 2018. Its annual rate a month ago was 8.0 percent and in December 2017, 1.7 percent.
Among the provinces in the region, Ilocos Norte recorded the highest inflation rate of 10.8 percent. This is lower than its November 2018 inflation of 11.6 percent. In December 2017, the province’s inflation was recorded at -0.4 percent.
Pangasinan posted the second highest inflation rate in the region at 8.0 percent, which was lower than its inflation rate in November 2018 of 8.9 percent. In December 2017 the province’s inflation is recorded at 1.7 percent.
The inflation rate in La Union eased to 4.7 percent in December 2018 from 6.2 percent in November 2018. In December a year ago, it was posted at 1.5 percent.
Ilocos Sur’s inflation rate also decelerated to 2.3 in December 2018 from 8.9 percent a month ago. In December 2017, the province’s inflation was recorded at 1.7 percent.
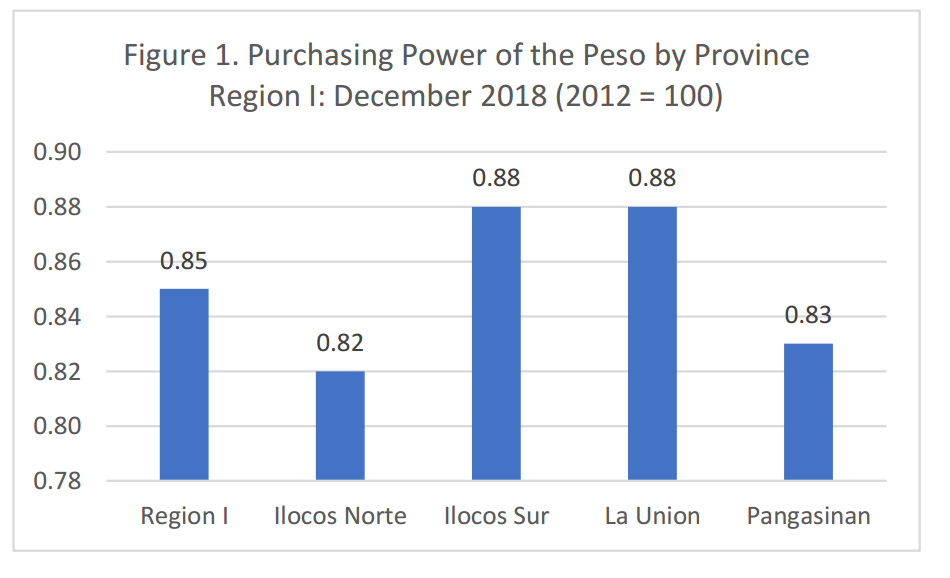
Purchasing Power of the Peso in Region I stood at 0.85 in December 2018
The Purchasing Power of Peso (PPP) in Region I was posted at PhP 0.85 in December 2018. This means that the purchasing capability of PhP 1.00 in 2012 decreased by 15 centavos in December 2018. Both La Union and Ilocos Sur recorded a PPP of PhP 0.88 while Pangasinan posted PhP 0.83 and Ilocos Norte recorded at PhP 0.82. Over-all in Region I, the value of a peso in 2012 was only equivalent to 85 centavos in December 2018.


TECHNICAL NOTES
The Consumer Price Index (CPI) is one of the regular outputs of the Philippine Statistics Authority (PSA). The CPI served as an indicator of the movement of prices of a fixed basket of goods and services commonly availed by households relative to a given base year. The CPI is most widely used in the calculation of the inflation rate and purchasing power of the peso. It is a major statistical series used for economic analysis and as a monitoring indicator of the government economic policy. The important components of the CPI are the base period, market basket, weighting system, formula and the geographical area.
Base Period/Base year
The base period is the period, usually a year, at which the index number is set to 100. It is the reference point of the index number series. The CPI is now rebased to 2012 base year from the current 2006 base year.
The year 2012 was chosen as the next base year because it was the latest year when the Family Income and Expenditure Survey (FIES) results were made available. It is also in accordance with the PSA Board Resolution No.1, Series of 2017-146, which approved the synchronized rebasing of the price indices to base year 2006 and every six (6) years thereafter.
To determine the commodities that will form the market basket for the 2012-based CPI, the updating of the 2006 basket through the Survey of Key Informants was conducted from 07 October to 15 November 2013. The survey was conducted nationwide to store managers, sellers or proprietors and were asked of the most commonly purchased items or commodities. The commodities are grouped according to the 2010 Philippine Classification of Individual Consumption According to Purpose (COICOP) which is based on the United Nations COICOP.
Market Basket
Since it is impossible to monitor the movement of prices of all the thousands of goods and services purchased and ultimately consumed by households in the county, a sample of these items, known as the “CPI market basket”, was selected to represent the composite price behavior of all goods and services purchased by the consumers. Said market baskets were composed of the goods and services commonly consumed/purchased/availed by households within a geographically bound area, which include food and beverages, alcoholic beverages and cigarettes, clothing, housing and utilities, furnishings and routine maintenance of household, health, transport, communication, recreation, education, restaurant and miscellaneous household expenditures.
The weights for the 2012-based CPI were derived from the expenditure data of the 2012 FIES, a survey that covered around 50,000 sample households nationwide. The weight for each item of expenditure is a proportion of that expenditure item to the total national expenditure. The total (all items) national expenditure weights is equal to 100.
Weighting System
To have a sound and meaningful system, the relevance of each component of the index should be considered, thus proper weighting pattern is a must. For the CPI, the weighting pattern uses the expenditures on various consumer items purchased by households as a proportion to the total expenditure based on the results of the 2012 FIES.
The 2012 FIES expenditure data were used to directly estimate the 2012 CPI weights at the national and regional levels. However, the 2012 FIES estimates for the expenditure data at the provincial level were not directly utilized in estimating the CPI expenditure weights as the data at the provincial/city level may not be reliable with the use of the households' master sample (MS) that was utilized in selecting the 2012 FIES sample households. The MS was drawn using regions as domains in generating estimates in all the household surveys of the PSA starting July 2003.
The provincial/city expenditure data were derived using the model-based method in small area estimation procedures using the regional expenditure data as the control total for all the expenditure data within the specific region. Using these estimates, the weight for each item of expenditure is computed as a proportion of that item of expenditure to the total national expenditure. A raking procedure was done to adjust the weights of the provinces so that the provincial weights when added up will equal to the regional weights.
Monitoring of Prices of Items in the Market Basket
This involves establishing baseline information for prices of the items in the base year and monitoring the prices of the items on a regular basis. Collection of data for the CPI is done by the provincial staff of the PSA. Except for food, beverage and tobacco (FBT) in NCR and petroleum products which are monitored on a weekly basis, price collection is generally done twice a month. First collection phase is done in the first five days of the month while the second phase is on the 15th to 17th day of the month. Data are collected from the sample outlets (outlets or establishments where prices of commodities/services are collected or quoted) which were chosen using the following criteria:
a. Popularity of an establishment along the line of goods to be priced - this means the sample outlet is publicly noted in the locality for selling goods included in the CPI market basket and the outlet is patronized by a large segment of the population.
b. Consistency and completeness of stock
Consistency of stock - the outlet has a constant, steady or regular stock of commodities listed in the CPI price collection forms as well as of those commodities of the same kind and belonging to the same commodity group.
Completeness of stock- the sample outlet carries in its stock many if not all of the items included in the CPI price collection forms relative to the other outlets in the area.
c. Permanency of outlet - the outlet is an established store or stall in the market area. It should not be an ambulant or transient vendor in order that the collection of data can be done for the succeeding survey rounds.
d. Geographical location- the outlet is conveniently located and is accessible to the majority of consumers in the area.
Formula
The PSA employed the weighted arithmetic mean of price relatives and the Laspeyre’s formula with a fixed base period weights.
Geographic Coverage
To effectively monitor the changes in price of basic commodities, the monitoring activity should be geographically bounded. The CPI values are computed at the national, regional and provincial levels, and for some selected cities. Separate computations are done for the National Capital Region.
Uses of CPI
One of the main uses of the CPI is the generation of the inflation rate. Inflation rate is the annual rate of change or the year-on-year change of the CPI expressed in percent. The formula is:

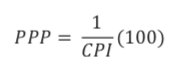
Another important economic indicator derived from the CPI is the Purchasing Power of the Peso (PPP). This indicator measures the real value of the peso in a given period relative to a chosen reference period. It is computed by getting the reciprocal of the CPI and multiplying the result by 100.
Approved for Release:
SGD. ATTY. SHEILA O. DE GUZMAN
(Chief Administrative Officer)
Office-in-Charge
| Attachment | Size |
|---|---|
|
|
3.72 MB |