

Release Date :
Reference Number :
Issue No. 14, Series of 2016
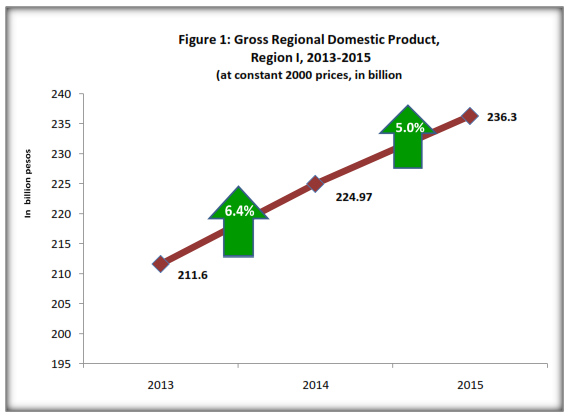
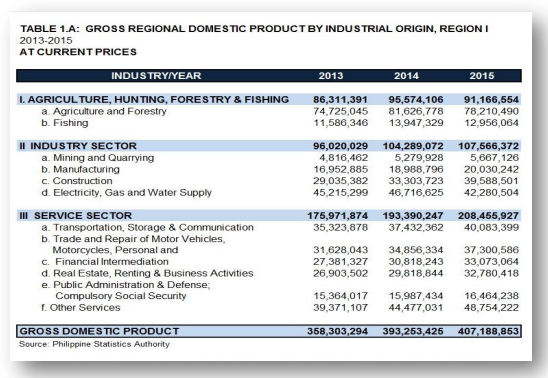
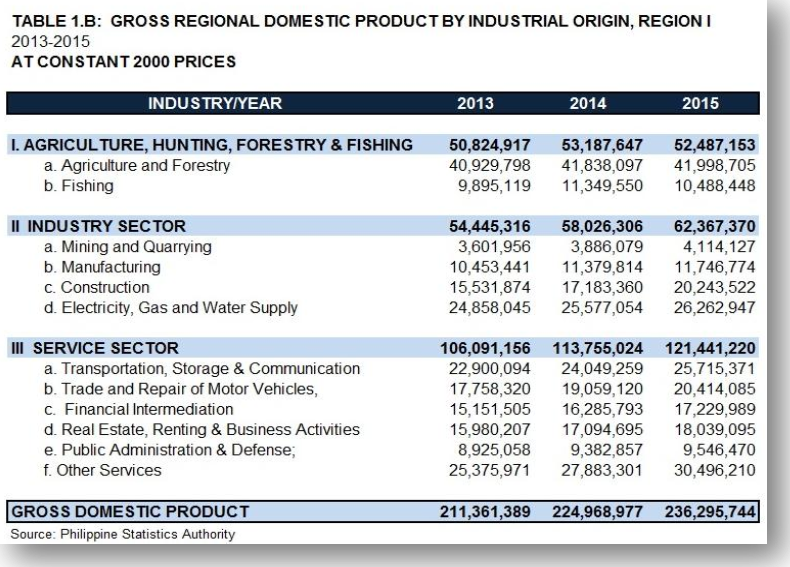
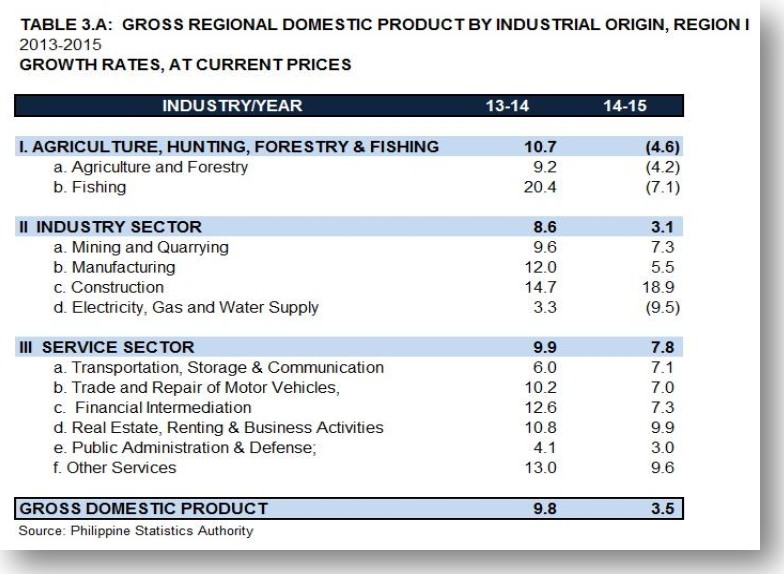
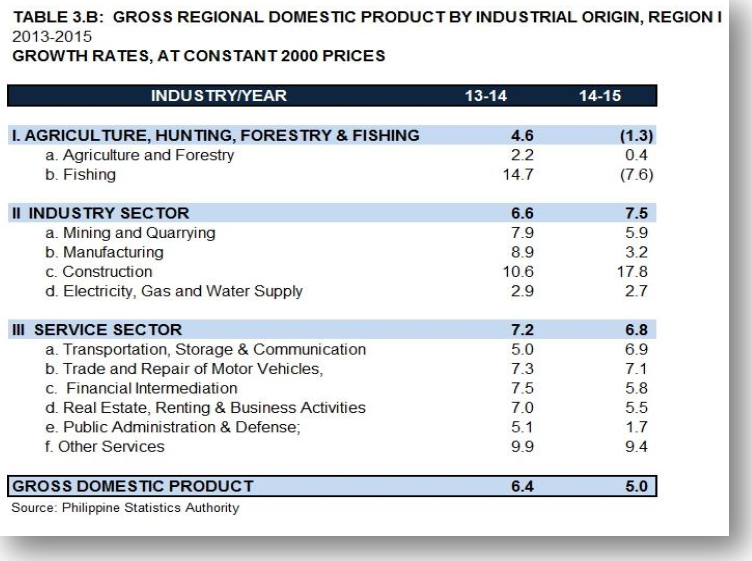
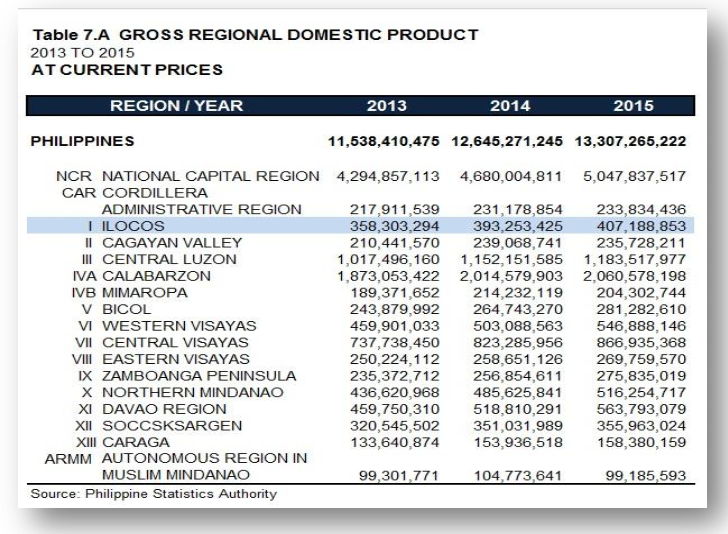
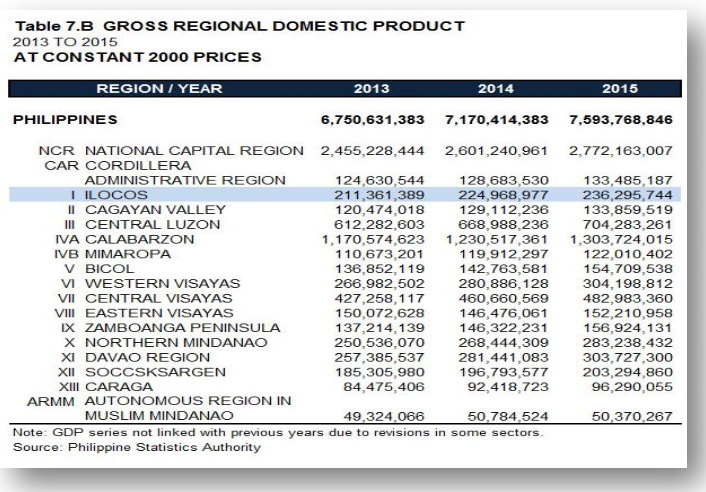
The Gross Regional Domestic Product (GRDP) of Region I, which measures the economic performance of the region, posted a 5.0 percent growth in 2015 though at slower rate as compared to 6.4 percent increase in 2014. The GRDP of Region I reached 236.30 billion pesos in 2015. Similarly, the national economy slowed down from 6.2 percent in 2014 to 5.9 percent in 2015.
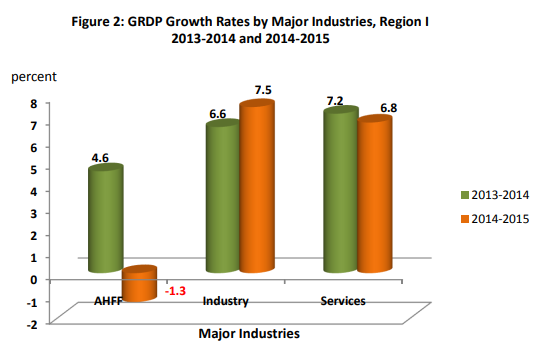
The slower performance of the region’s economy in 2015 was due to the decline in the Agriculture, Hunting, Forestry and Fishing (AHFF) and deceleration in the Services.
Services in the region slowed down from 7.2 percent in 2014 to 6.8 percent in 2015. On the other hand, Industry grew from 6.6.percent in 2014 to 7.5 percent in 2015. Meanwhile, AHFF contracted from 4.6 percent in 2014 to negative 1.3 percent in 2015.
GRDP GROWTH RATES
From 2010 to 2013, the GRDP growth rates of Region I continued to accelerate. However, in 2014, the growth of the region’s economy slowed down from 7.0 percent in 2013 to 6.4 percent in 2014 and further decelerated to 5.0 percent in 2015.
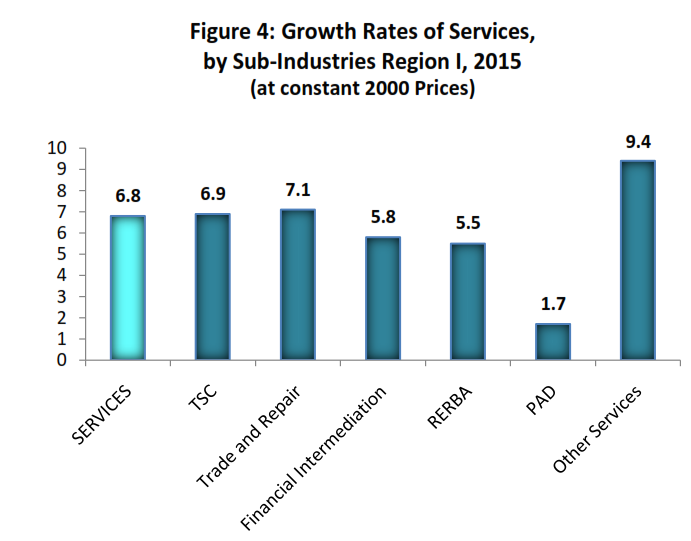
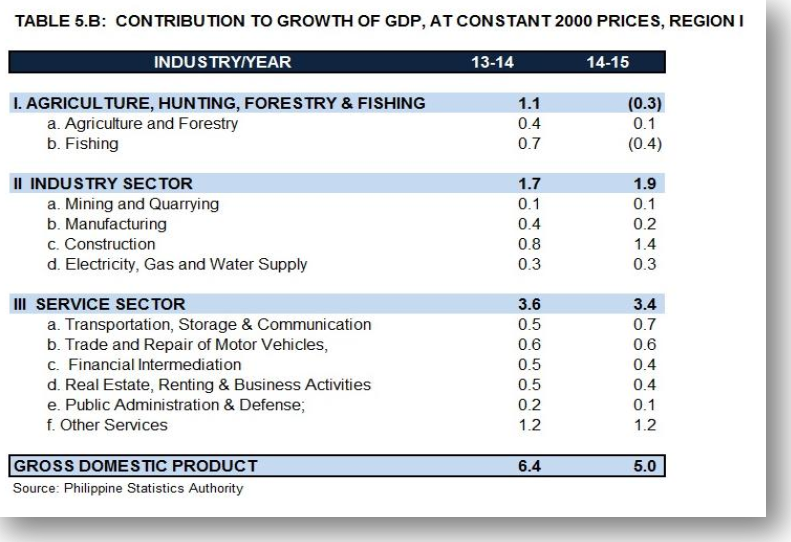
The deceleration of Services was due to the slower growths of all its sub-industries except Transportation, Storage and Communication (TSC). The biggest deceleration was recorded by Public Administration, Defense and Compulsory Social Security (PAD) with a growth of 5.1 percent in 2014 to 1.7 percent in 2015. Financial Intermediation (FI) also slowed down from 7.5 percent growth in the previous year to 5.8 percent this year. Likewise, Other Services (OS), Trade and Real Estate, Renting and Business Activities (RERBA) posted lower growths at 9.4, 7.1, and 5.5 percent, respectively. On the other hand, TSC recorded a faster growth from 5.0 percent in 2014 to 6.9 percent in 2015.
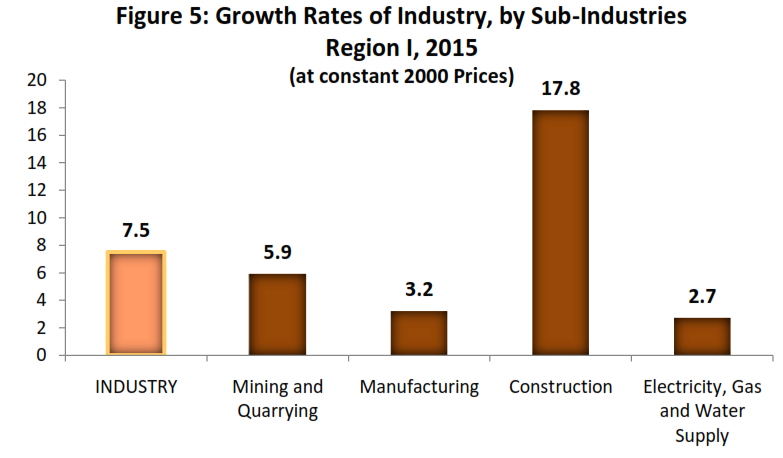
The faster growth of the Industry was attributed to the accelerated growth in Construction from 10.6 percent in 2014 to 17.8 percent in 2015. Meanwhile, Manufacturing experienced the biggest deceleration from 8.9 percent in 2014 to 3.2 percent in 2015. Mining and Quarrying (MAQ) and Electricity, Gas, and Water Supply (EGWS) also slowed down at 5.9 and 2.7 percent, respectively.
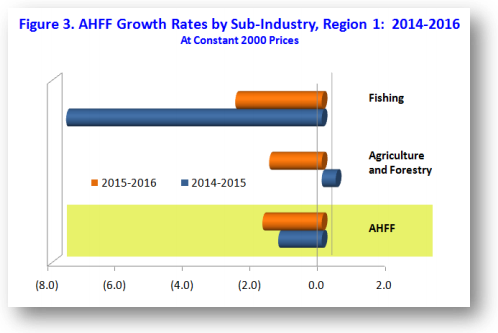
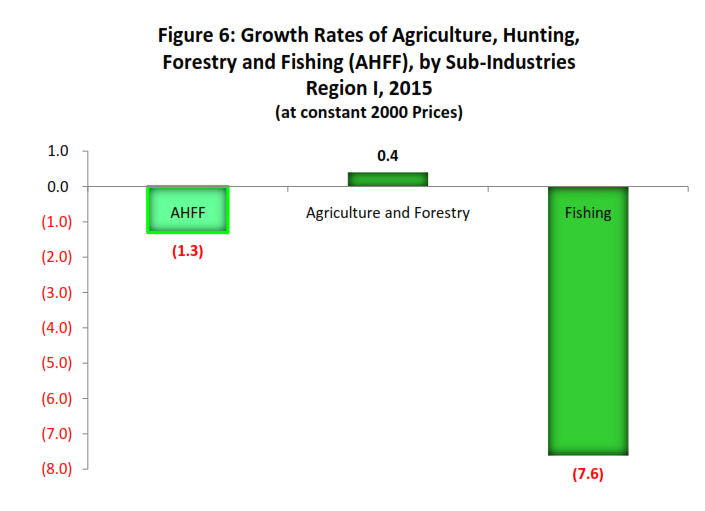
The decline of AHFF was due to the contraction of Fishing by negative 7.6 percent in 2015.
Meanwhile, Agriculture and Forestry grew slower from 2.2 percent in 2014 to 0.4 percent in 2015.
PERCENT DISTRIBUTION OF INDUSTRIES
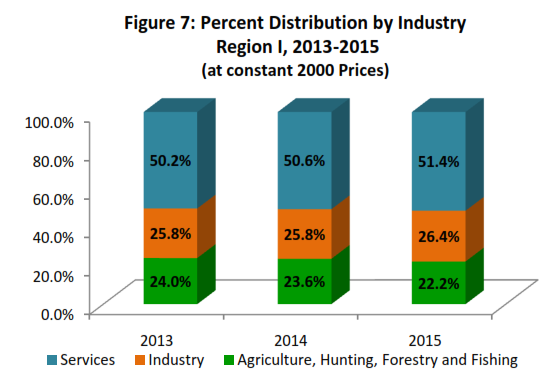
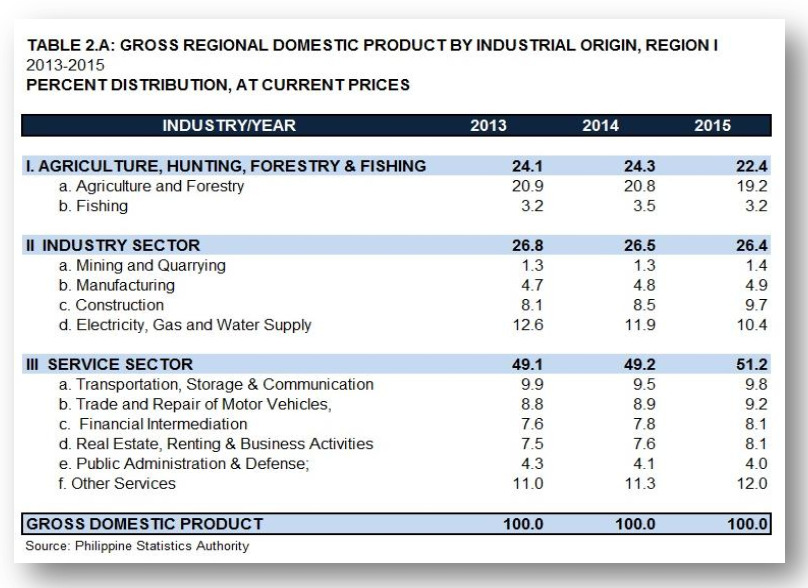
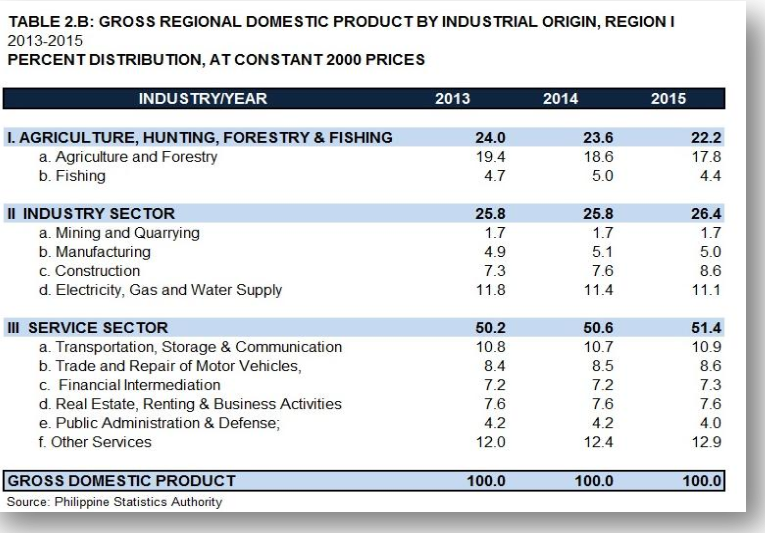
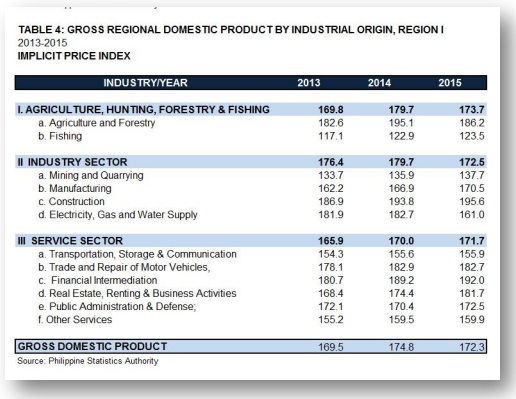
The economy of Region I remained to be service-driven as it accounted 51.4 percent of the region’s total economic outputs in 2015, higher than its percentage share of 50.6 percent in 2014. Industry on the other hand continued to grew from a share of 25.8 percent in 2014 to 26.4 percent in 2015. Meanwhile, contribution of AHFF to the region’s economy was decreasing from 24.0 percent in 2013 to 23.6 percent in 2014, and further declined to 22.2 percent in 2015.
Of the total 52.49 billion pesos Gross Value Added (GVA) of AHFF in 2015, Agriculture and Forestry accounted 80.2 percent, while Fishing comprised 19.8 percent.

Meanwhile, 42.0 percent of the 62.37 billion pesos GVA of Industry in 2015 was from the Electricity, Gas and Water Supply (EGWS). Construction on the other hand, contributed 32.6 percent, while Manufacturing and Mining and Quarrying (MAQ) comprised 18.9 and 6.4 percent, respectively, of the total GVA of the Industry in the same year.
In 2015, Other Services (OS) which includes Education, Hotel and Restaurant, Health and Social Works, accounted for 25.1 percent of the total 121.44 billion pesos GVA of the region’s Services. Meanwhile, Transportation, Storage and Communication (TSC) comprised 21.2 percent. This was followed by Trade and Repair of Motor Vehicles (16.8 percent), Real Estate, Renting and Business Activities (RERBA) (14.8 percent), Financial Intermediation (14.2 percent), and Public Administration and Defense (7.8 percent).
CONTRIBUTION TO GROWTH
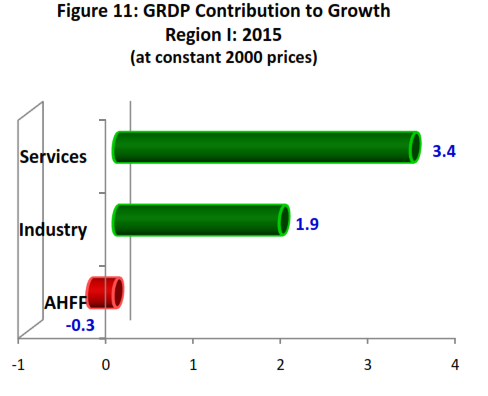
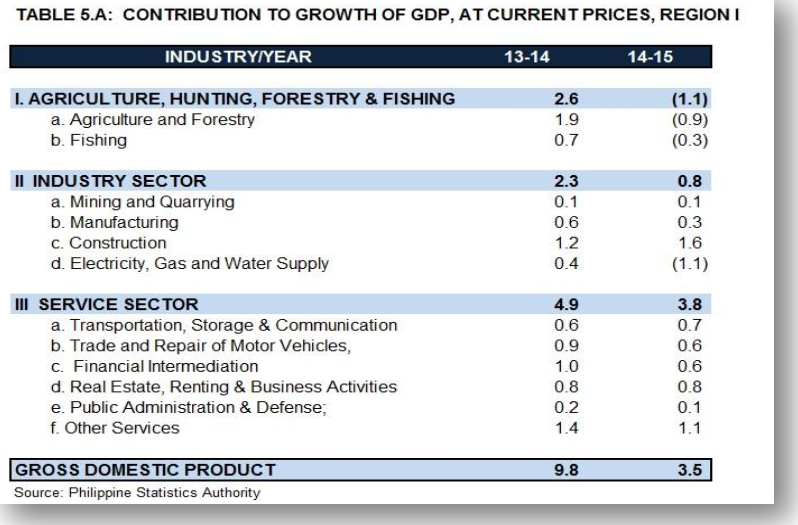
Services contributed the biggest share to the region’s 5.0 percent growth in 2015 at 3.4 percentage points. Likewise, the Industry contributed 1.9 percentage points. On the other hand, AHFF pulled down the region’s economic performance by 0.3 percentage point.
PER CAPITA GRDP
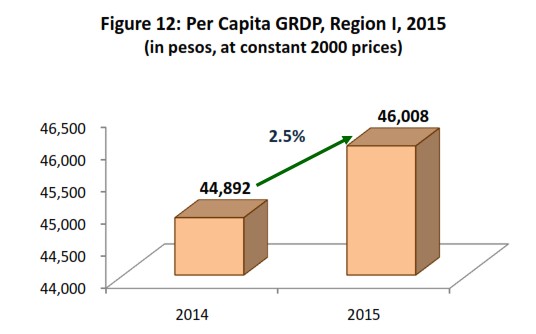
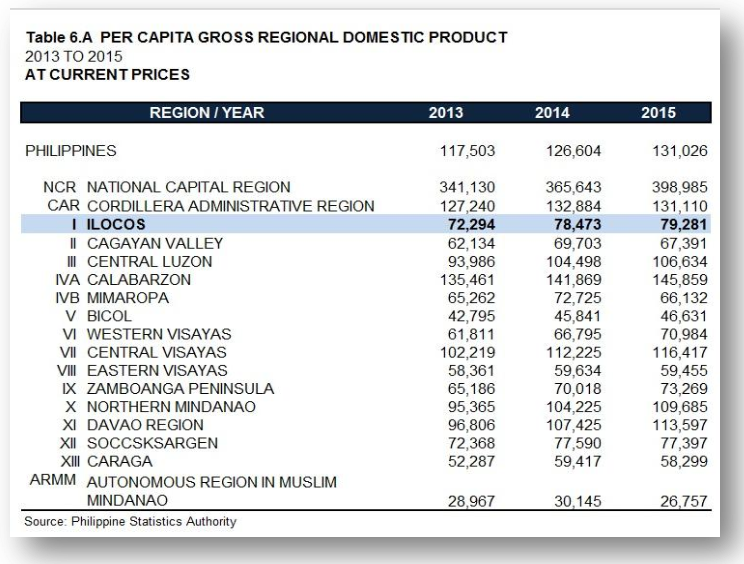
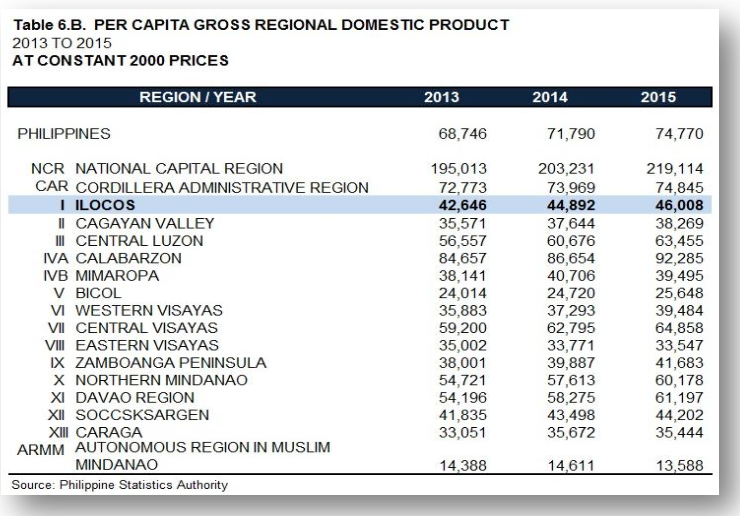
Per Capita GRDP of Region I was Php 46,008 in 2015. This was 2.5 percent higher than the Php 44,892 per capita GRDP posted in 2014. The 2014 Per Capita GRDP index of the region is 61.5 percent to the national average of Php 74,770.
REGION’S PERFORMANCE vis a vis OTHER REGIONS
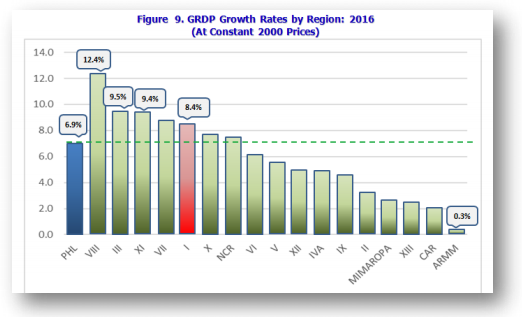
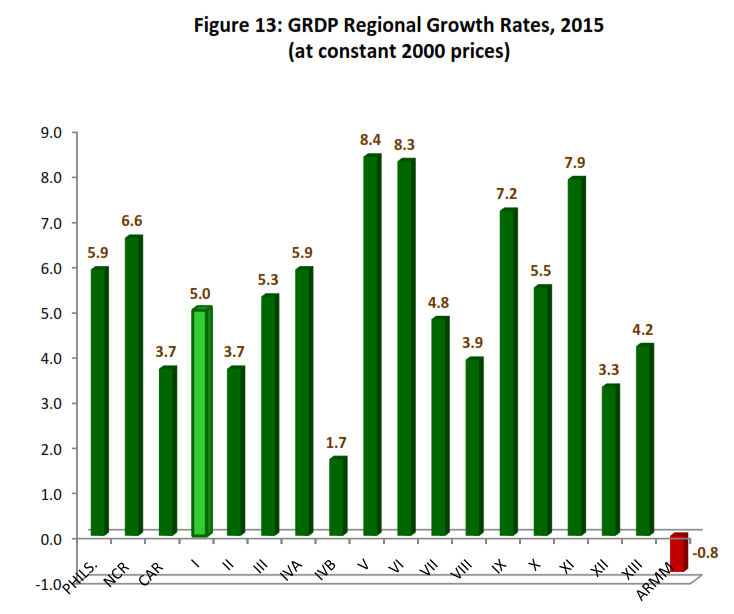
Region I ranked 9th among 17 regions in terms of GRDP growth in 2015. Meanwhile, Region V (Bicol) recorded the highest growth rate at 8.4 percent, followed by Region VI (Western Visayas) at 8.3 percent.
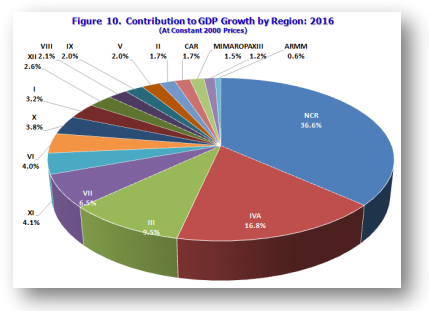
On the other hand, Region I contributed 3.1 percent to the National Gross Domestic Product (Php 7.59 Trillion) in 2015 and was ranked 8th in terms of regional shares. NCR, Region IVA (CALABARZON) and Region III (Central Luzon), on the other hand, remained the top three regions with highest shares in the GDP.
In terms of contribution to growth, Region I contributed 0.2 percentage point to the 5.9 percent GDP growth in 2015. NCR remained the top contributor to the national growth at 2.4 percentage points.
TECHNICAL NOTES
· System of National Accounts (SNA) - Consists of a coherent, consistent and integrated set of macroeconomic accounts, balance sheets and tables based on a set of internationally agreed concepts, definitions, classifications and accounting rules.
· Gross Domestic Product – the value of all goods and services produced domestically; the sum of gross value added of all resident institutional units engaged in production (plus any taxes, and minus any subsidies, on products not included in the values of their outputs).
· Gross Regional Domestic Product - aggregate of the gross value added or income from each industry or economic activity of the regional economy.
· Gross Value Added – the difference between gross output and intermediate inputs. Gross outputs of a production unit during a given period is equal to the gross value of the goods and services produced during the period and recorded at the moment they are produced, regardless of whether or not there is a change of ownership. Intermediate inputs refer to the value of goods and services used in the production process during the accounting period.
· Constant Prices (at constant prices) – valuation of transactions, wherein the influence of price changes from the base year to the current year has been removed.
· Current Prices (at current prices) – valuation of transactions based on prices during the reference year.
Statistical Tables:

| Attachment | Size |
|---|---|
|
|
2.05 MB |