

Release Date :
Reference Number :
2018-11
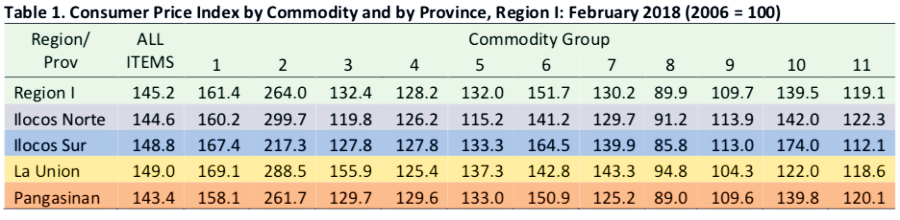
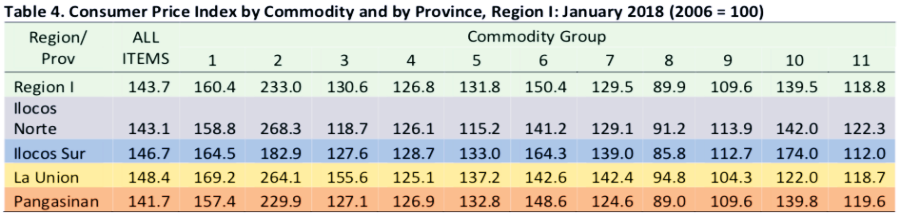
The Consumer Price Index (CPI) of Region I for February 2018 was recorded at 145.2. This figure was increased by 6.6 percentage points compared to the last year index (138.6) and by 1.5 percentage points over last month index of 143.7. The commodity groups, which recorded high price indices, were alcoholic beverages and tobacco (264.0), food and non-alcoholic beverages (161.4), and health (151.7). On the other hand, the commodity groups, which showed lower price indices, were communication (89.9), recreation and culture (109.7), and restaurant and miscellaneous goods and services (119.1).
By province, La Union posted the highest consumer price index in February 2018 at 149.0 and followed by Ilocos Sur with 148.8. Third was Ilocos Norte with a Consumers Price Index of 144.6. On the other hand, Pangasinan recorded the lowest price index at 143.4.
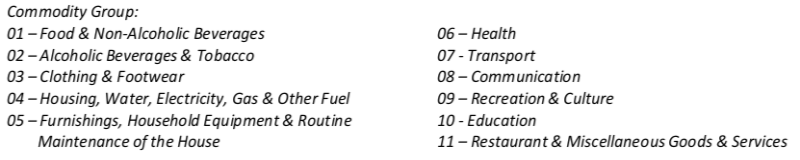
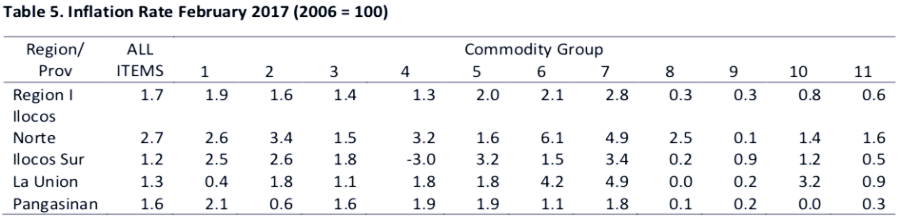
Inflation Rate in Region I marked at 4.8 in February 2018
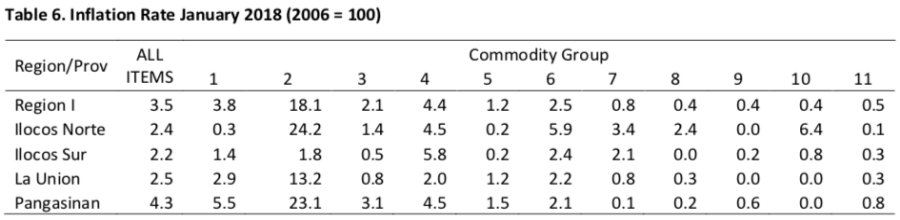
The February 2018 inflation rate of 4.8 percent in Region I increased by 1.3 percentage points from 3.5 percent in January 2018. February 2018 inflation rate also increased by 3.1 percentage points from 1.7 percent in February 2017.
Among the provinces in the region, Pangasinan posted the highest inflation rate at 5.8, which was higher by 1.5 percentage points than the inflation rate of January 2018 and 4.2 percentage points higher than that in February 2017.
Ilocos Norte recorded the inflation rate of 4.0 percent which was higher by 1.6 percentage points as compared to the previous month and increased by 1.3 percentage points if compared to February last year
Ilocos Sur obtained an inflation rate of 3.7 for the month of February 2018. This figure was higher by 1.5 percentage pointsas compared to the province’s inflation rate in the previous month and increased by 2.5 percentage points than the inflation rate last February 2017.
The province of La Union recorded an inflation rate of 3.0 percent, which increased by 0.5 percentage point with respect to the inflation rate last month and increased by 1.7 percentage points from February 2017 inflation rate.
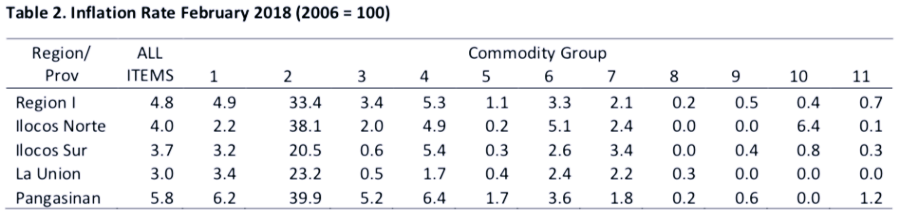
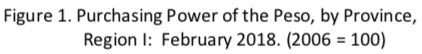
Purchasing Power of the Peso in Region I stood at 0.69 in February 2018
In terms of the purchasing power of the peso (PPP), Pangasinan recorded the highest in the region at 0.70, which typically means that the value of peso in 2006 was equivalent to 70 centavos in February 2018. This was followed by Ilocos Norte with a purchasing power of 0.69. The lowest was recorded by Ilocos Sur and La Union at 0.67. Over-all in Region I, the value of a peso in 2006 was only equivalent to 69 centavos in February 2018.
TECHNICAL NOTES
The Consumer Price Index (CPI) is one of the regular outputs of the Philippine Statistics Authority (PSA). The CPI served as an indicator of the movement of prices of a fixed basket of goods and services commonly availed by households relative to a given base year. The CPI is most widely used in the calculation of the inflation rate and purchasing power of the peso. It is a major statistical series used for economic analysis and as a monitoring indicator of the government economic policy. The important components of the CPI are the base period, market basket, weighting system, formula and the geographical area.
Base Period/Base year
The base period, also coined as the base year, is a reference date at which the index is taken as equal to 100. Since CPI aims to measure the average movement of retail prices of a fixed basket of goods and services, it is necessary to compare the changes in prices in the current year to movements in previous years back to a reference date. This reference date or base period is simply a convenient benchmark to which a continuous series of index can be related and has no numerical significance.
Base period refers to a year. Specific month is deemed unwise to use as a base period because it often reflects accidental or seasonal influences to prices of goods and services. Thus, base year is often defined as a synonymous term with base period.
The current series uses 2006 as the base period as per the former National Statistical Coordination Board (NSCB) Resolution Number 2, Series of 2009 approving the synchronized rebasing of the price indices. It was also chosen as the base year because it is the year when the Family Income and Expenditure Survey (FIES) was conducted. The results of the FIES serve as basis in the determination of weights.
The CPI is yet to undergo another rebasing from the current 2006 to the 2012 base period. Thus, since August 2014, additional new items for the 2012-based market basket were simultaneously collected with the regular monitoring of prices.
Market Basket
Since it is impossible to monitor the movement of prices of all the thousands of goods and services purchased and ultimately consumed by households in the county, a sample of these items, known as the “CPI market basket”, was selected to represent the composite price behavior of all goods and services purchased by the consumers. Said market baskets were composed of the goods and services commonly consumed/purchased/availed by households within a geographically bound area, which include food and beverages, alcoholic beverages and cigarettes, clothing, housing and utilities, furnishings and routine maintenance of household, health, transport, communication, recreation, education, restaurant and miscellaneous household expenditures.
The market basket used in the 2006-based CPI for all income households was derived from goods and services usually consumed by 70% of the upper household and the bottom 30% income group households drawn from the results of the 2007-2008 Commodity and Outlet Survey (COS). The COS is a nationwide survey undertaken by the former National Statistics Office (NSO), now part of the newly organized PSA. It aims to gather data on commodities and services that a family purchased, consumed or availed of most of the times and the outlet/s where said commodities and services were purchased/availed of within the country.
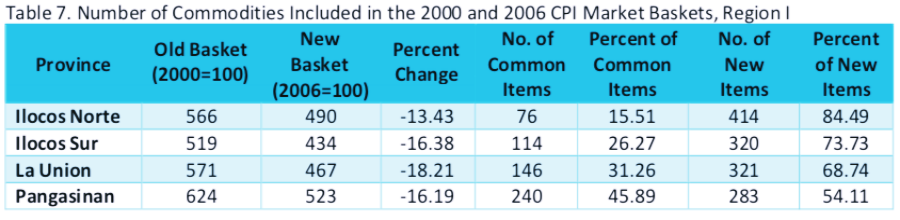
There are 80 provincial market baskets in our country including the market basket for the National Capital Region (NCR), Isabela City and Cotabato City. In our region, there are four market baskets, one for each province. The number of commodities and the comparisons with the 2000-based market baskets are presented in Table 7.
Weighting System
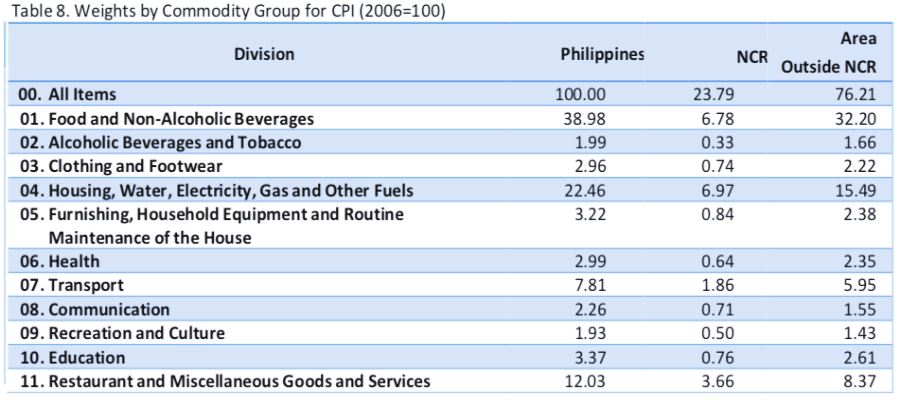
To have a sound and meaningful system, the relevance of each component of the index should be considered, thus proper weighting pattern is a must. For the CPI, the weighting pattern uses the expenditures on various consumer items purchased by households as a proportion to the total expenditure based on the results of the 2006 FIES. Table 8 shows the weights of the eleven United Nations Classification of the Individual Consumption According to Purpose (COICOP) divisions used in the computation of the CPI.
Formula
The PSA employed the weighted arithmetic mean of price relatives and the Laspeyre’s formula with a fixed base period weights.
Geographic Coverage
To effectively monitor the changes in price of basic commodities, the monitoring activity should be geographically bounded. The CPI values are computed at the national, regional and provincial levels, and for some selected cities. Separate computations are done for the National Capital Region.
Uses of CPI
One of the main uses of the CPI is the generation of the inflation rate. Inflation rate is the annual rate of change or the year-on-year change of the CPI expressed in percent. The formula is:

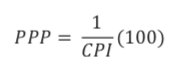
Another important economic indicator derived from the CPI is the Purchasing Power of the Peso (PPP). This indicator measures the real value of the peso in a given period relative to a chosen reference period. It is computed by getting the reciprocal of the CPI and multiplying the result by 100.


| Attachment | Size |
|---|---|
|
|
811.34 KB |