

Release Date :
Reference Number :
2021-01
The economy of Ilocos Region grew by 6.9 percent in 2019, higher than the 5.9 percent growth in the previous year. The region’s Gross Domestic Product (GDP) in 2019 was estimated at 627.9 billion pesos, at constant 2018 prices. This was higher by 40.3 billion pesos than the estimated value of 587.6 billion pesos in 2018
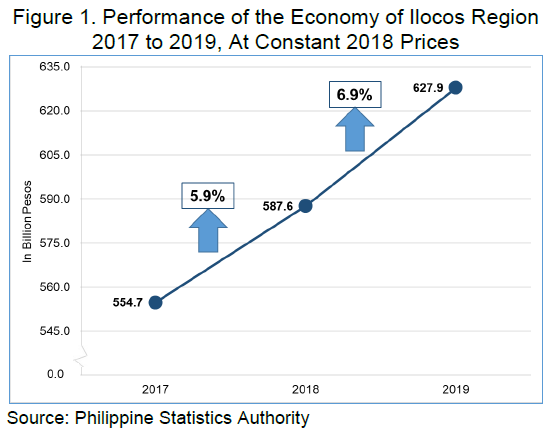
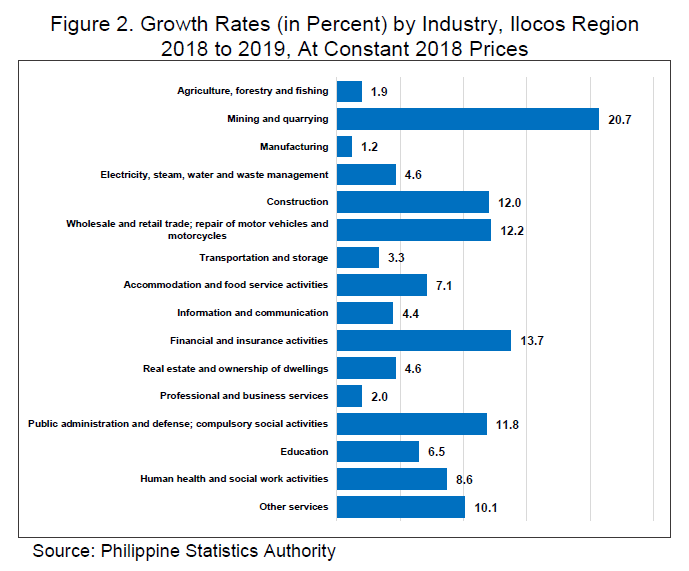
Figure 2 shows the growth rates of industries in Ilocos Region. Mining and quarrying registered the highest growth of 20.7 percent, from 1.2 billion pesos in 2018 to 1.5 billion pesos in 2019. On the other hand, the manufacturing industry recorded the lowest growth in 2019 at 1.2 percent, from 53.1 billion pesos in 2018 to 53.7 billion pesos in 2019. Agriculture, forestry and fishing (AFF) recorded 1.9 percent growth rate. For electricity, steam, water and waste management, 4.6 percent; construction, 12.0 percent; wholesale and retail trade and repair of motor vehicles and motorcycles, 12.2 percent; transportation and storage, 3.3 percent; accommodation and food service activities, 7.1 percent; information and communication, 4.4 percent; financial and insurance activities, 13.7 percent; real estate and ownership of dwellings, 4.6 percent; professional and business services, 2.0 percent; public administration and defense, 11.8 percent; education, 6.5 percent; human health and social work activities, 8.6 percent; and other services 10.1, percent growth rate.
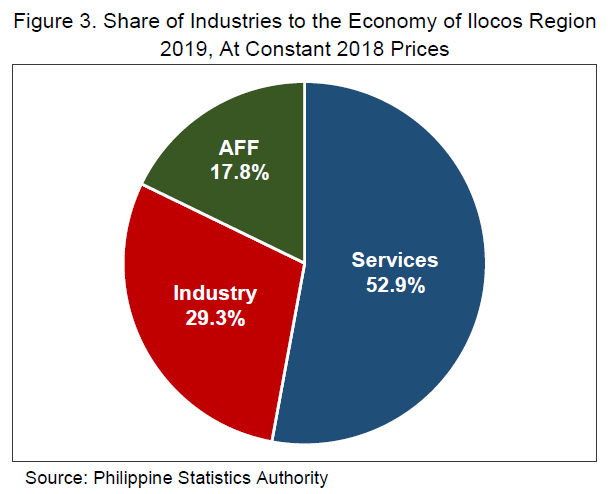
The economy of Ilocos Region is predominantly Services-based, accounting for 52.9 percent of the total GRDP, followed by Industry with a share of 29.3 percent. AFF had the lowest percentage share of 17.8 percent (Figure 3).
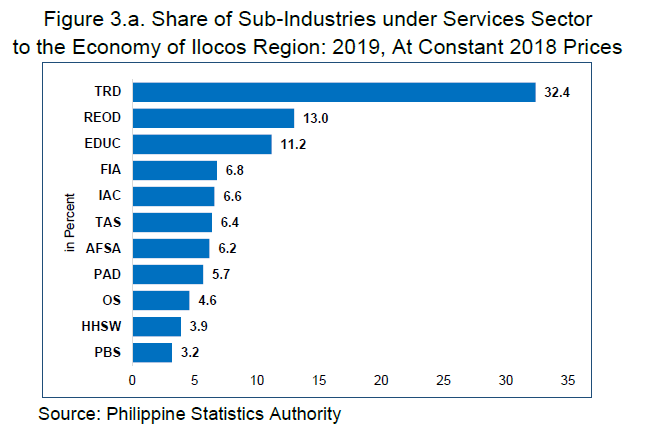
In terms of the distribution of the sub-industries on the Services Sector, wholesale and retail trade and repair of motor vehicles and motorcycles accounted for the biggest share of 32.4 percent. This was followed by the real estate and ownership of dwellings with 13.0 percent share; education with 11.2 percent share; finance and insurance activities with 6.8 percent share; information and communication with 6.6 percent; transportation and storage with 6.4 percent; accommodation and food services activities with 6.2 percent share; public administration and defense with 5.7 percent share; other services with 4.6 percent; human health and social work activities with 3.9 percent. The least, professional and business activities with 3.2 percent.
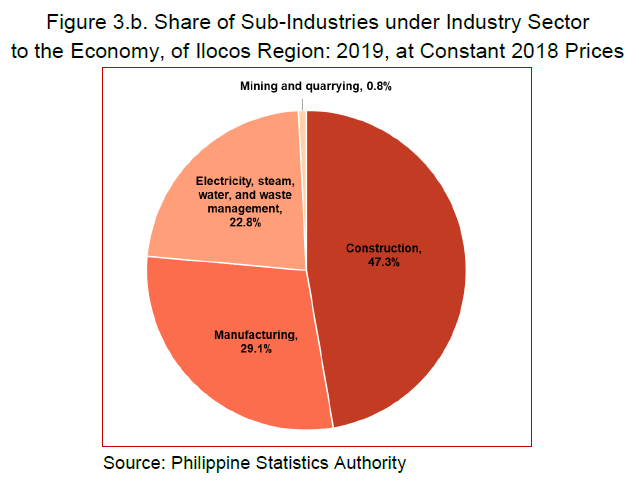
For the Industry sector, construction accounted for the biggest share with 47.3 percent. Manufacturing followed with 29.1 percent share while Electricity, Steam, Water and Waste Management accounted for 22.8 percent. Meanwhile, Mining and quarrying had the least share with only 0.8 percent.
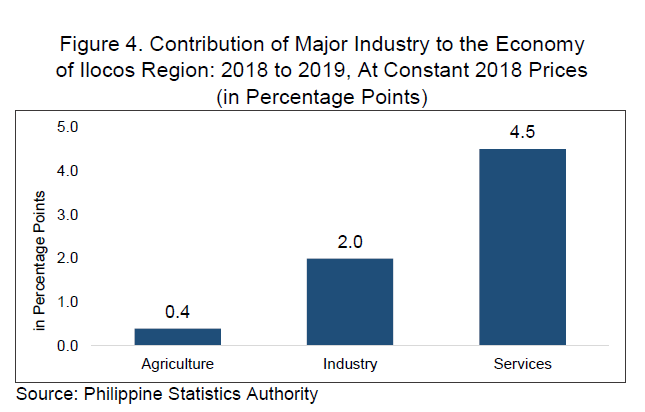
In terms of the contribution of the industries to the overall economic growth of the region, it can be seen in Figure 4 that Services contributed the biggest percentage points of 4.5 out of the total 6.9 percentage growth. The Industry sector contributed 2.0 percentage points while AFF contributed 0.4 percentage point.
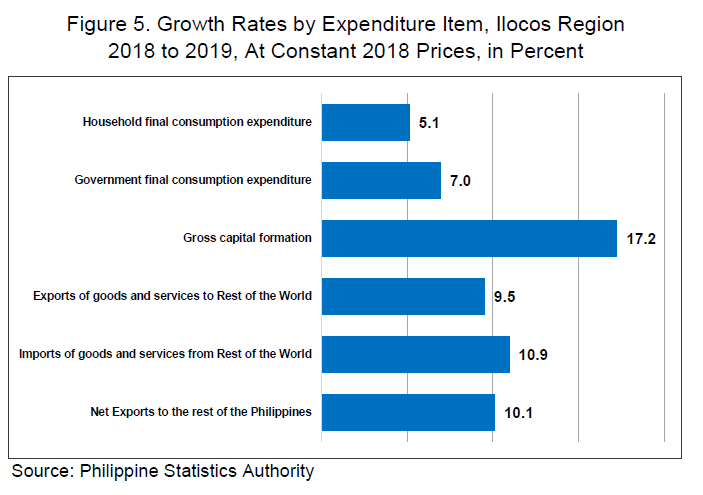
As for the growth rates by expenditure, it is manifested in Figure 5 that gross capital formation had the highest growth at 17.2 percent. Gross capital formation includes valuables, changes in inventories, and gross fixed capital formation in construction, durable equipment, breeding stocks and orchard development, and intellectual property products. This was followed by the imports of goods and services from the rest of the world with 10.9 percent; net exports to the rest of the Philippines at 10.1 percent; exports of goods and services to the rest of the world with 9.5 percent; government final consumption expenditure with 7.0 percent; and finally, household final consumption expenditure with 5.1 percent growth rate.
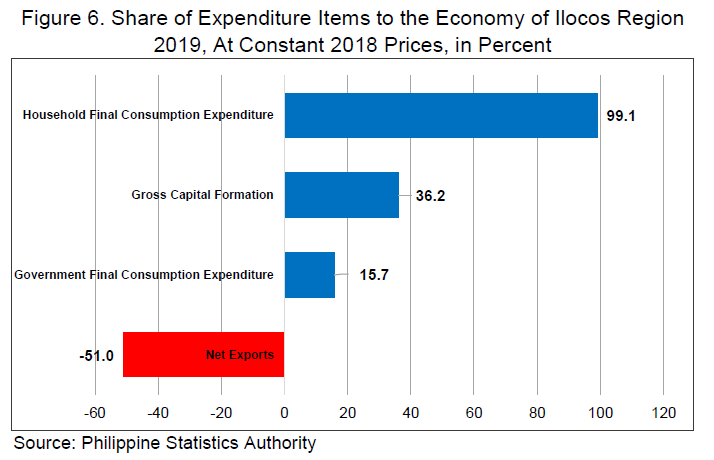
In terms of share of expenditure items to the regional economy, household final consumption expenditure had the highest share with 99.1 percent. This was followed by gross capital formation with 36.2 percent share; and government final consumption expenditure with 15.7 percent share. A negative percent share was recorded by net exports with 51.0 percent.
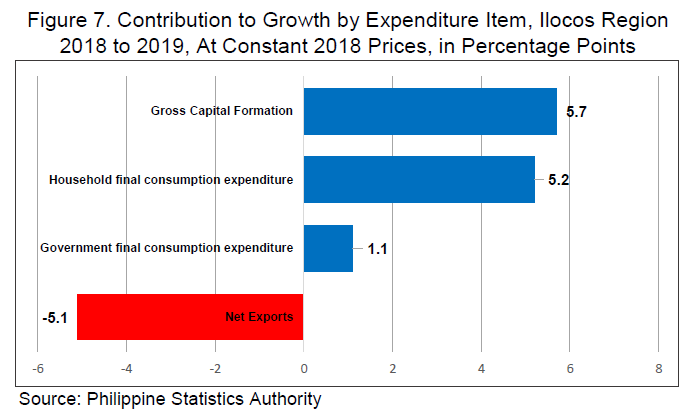
With the 6.9 percent growth rate in 2019, Figure 7 shows that gross capital formation had the highest contribution with 5.7 percentage points, followed by household final consumption expenditure and government final consumption expenditure with 5.2 percentage points and 1.1 percentage points, respectively. Meanwhile, a negative contribution to growth was recorded by net exports at 5.1 percentage points.
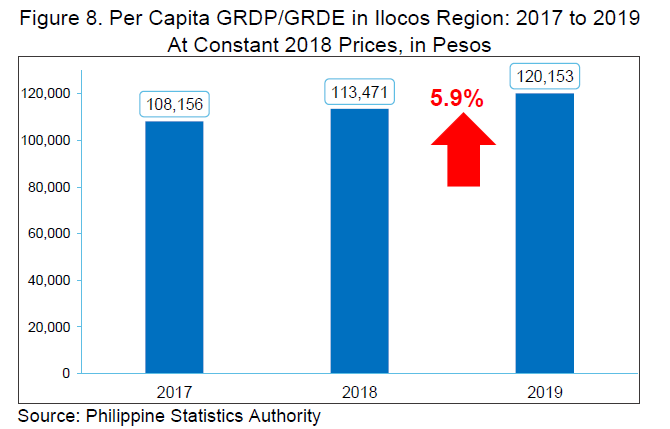
The per capita GRDP/GRDE of Ilocos Region in 2019 was estimated at 120,153 pesos, a growth of 5.9% from the previous year.
Per capita GRDP is the total GRDP level of the region divided by its total population to see how much each individual contributes to the regional economy.
Meanwhile, the per capita Household Final Consumption Expenditure of Ilocos Region in 2019 was estimated at 119,066 pesos, a growth of 4.2 percent from the previous year’s level of 114,290 pesos.
The share of each person to the total GRDP/GRDE or the per capita GRDP/GRDE of Ilocos Region was recorded at 120,153 pesos, lower than the national per capita GDP of 180,528 pesos.
Ilocos Region ranked 9th in terms of per capita GRDP among all regions. National Capital Region ranked first.
The 2019 per Capita Index of Ilocos Region to the National Average is 66.6 percent.
Among the 17 regions, six regions, including Ilocos Region, posted higher growth rates than the national GDP growth of 6.0 percent.
Bicol Region grew the fastest at 7.4 percent, followed by NCR and Davao Region growing by 7.2 and 7.0 percent, respectively.
In terms of the economic structure, Ilocos Region is one of the 16 regions whose economy is predominantly Services-based in 2019.
Meanwhile, Region IVA is the only region predominantly industrial while no region was predominantly agricultural.
SGD. ATTY. SHEILA O. DE GUZMAN
Officer-in-Charge, RSSO I
| Attachment | Size |
|---|---|
|
|
1.13 MB |